Analyzing spatial patterns in biodiversity data
São Paulo School of Advanced Science (SPSAS)
Co-designing Biodiversity Assessments
October 31, 2024
Access to slides

Maurício Vancine
- Ecologist and PhD in Ecology
- Post-Doc in Spatial Ecology (Prof. Mathias - Unicamp)
- Spatial Ecology
- Ecological Modeling
- Ecological and Spatial Data Analysis
- Amphibian Ecology and Conservation
- Open source (R, QGIS, GNU/Linux)
Content
- Biodiversity concepts
- Species occurrences
- Spatial analysis
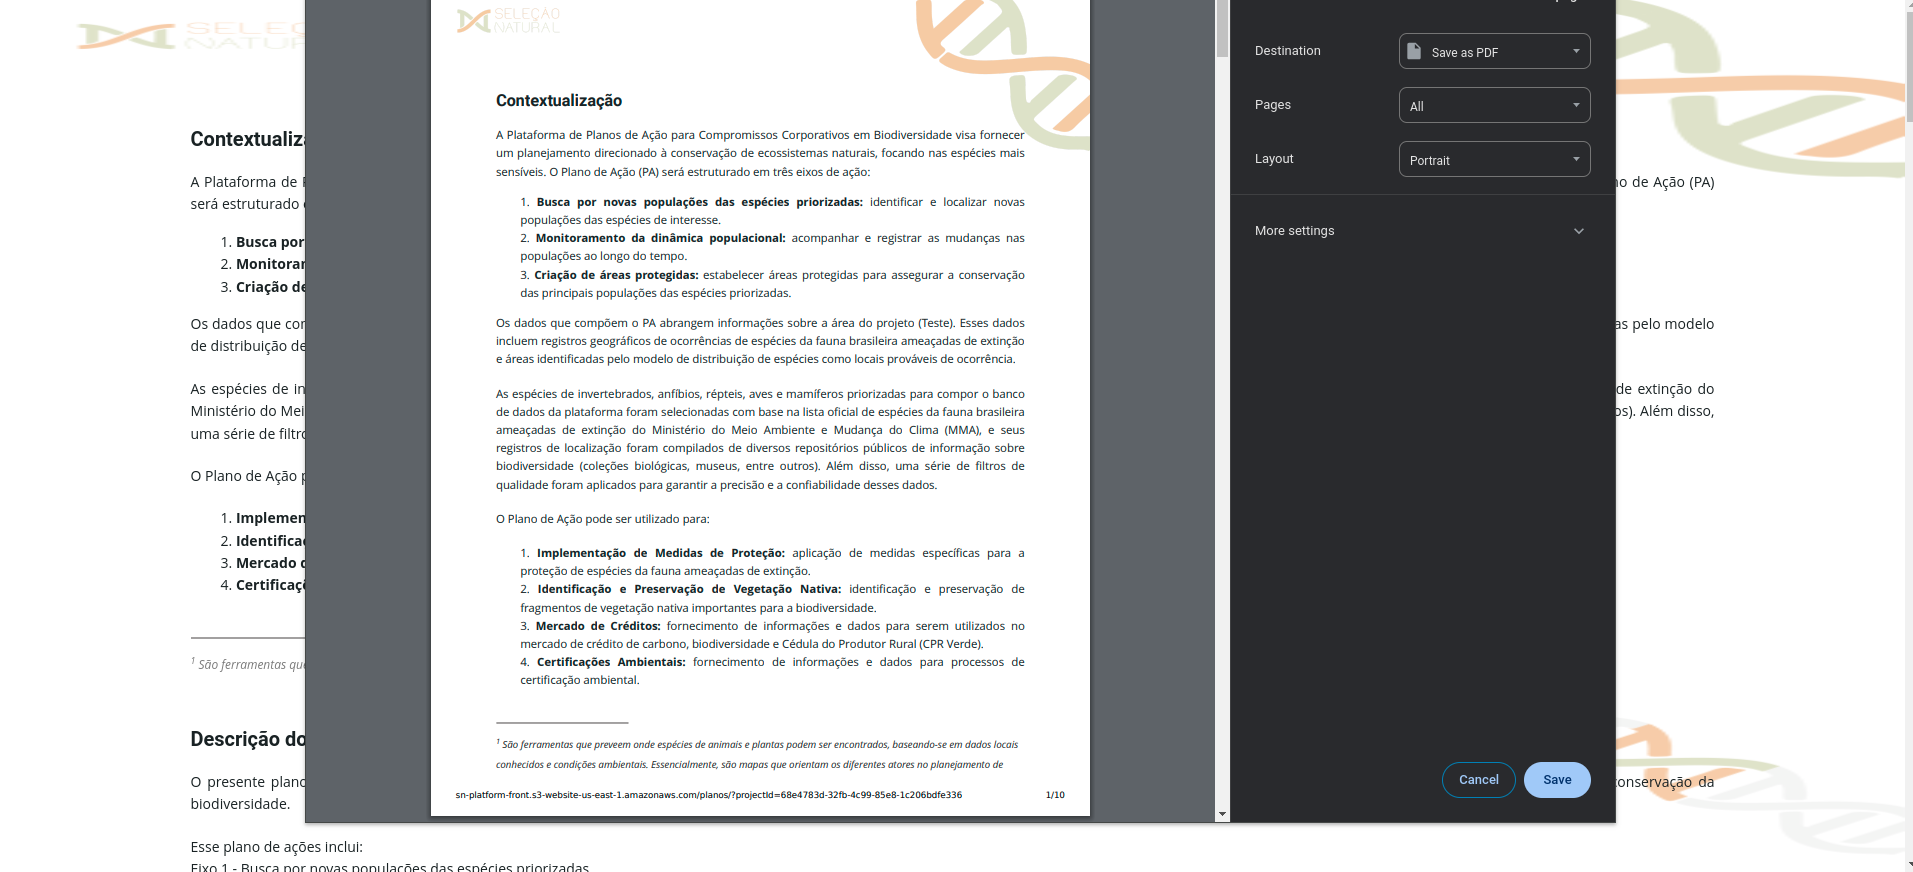
- Application: Seleção Natural Platform
- Install R and RStudio
- Install packages
- Computer testing
- Basic R explanation (maybe)
- Basic R explanation
- Species occurrences
- Spatial analysis
Objectives
- Contribution of spatial data and analysis to biodiversity knowledge
- Basic tools for downloading and cleaning species occurrence data
- Basic tools for spatial analysis:
- Spatial units (grids, hexagons, convex hull)
- Point density (kernel maps)
- Species Distribution Modeling (very basic)
IMPORTANT!!!
We are in a safe and friendly space
Feel free to interrupt me and ask questions

IMPORTANT!!!
My English is a work in progress…

Biodiversity concepts
What is biodiversity?
Sustainable Ecology and Economic Development (SEED)
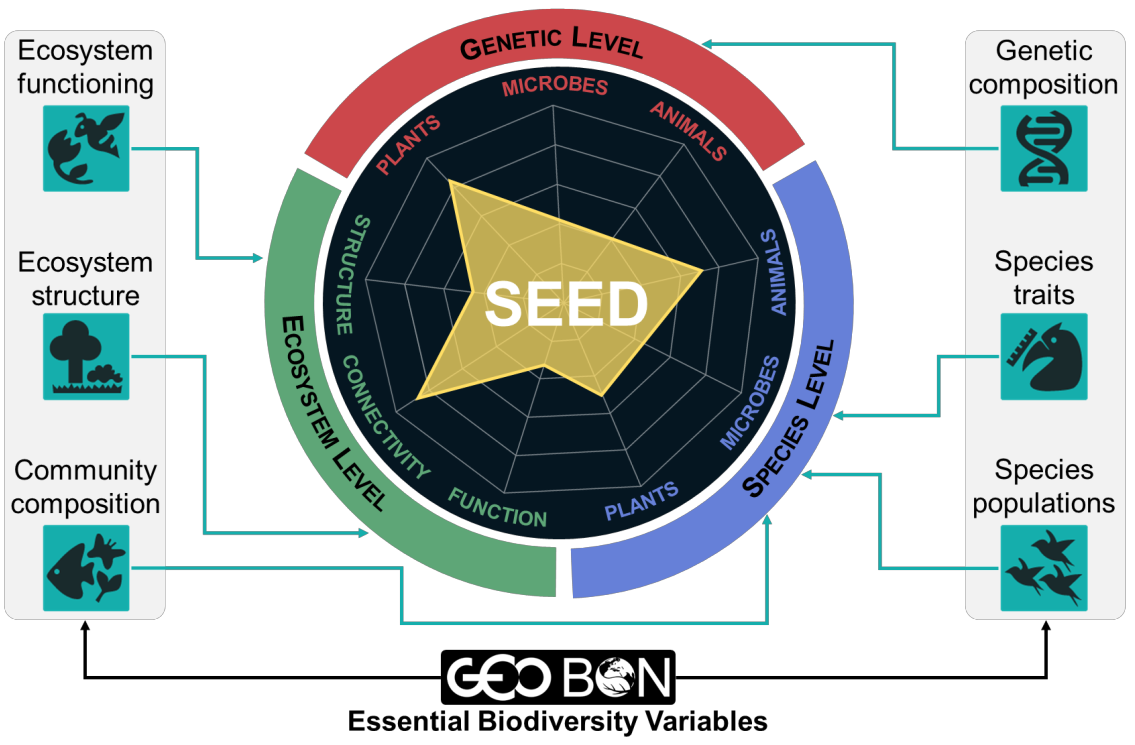
Biodiversity concepts
How to measure biodiversity?
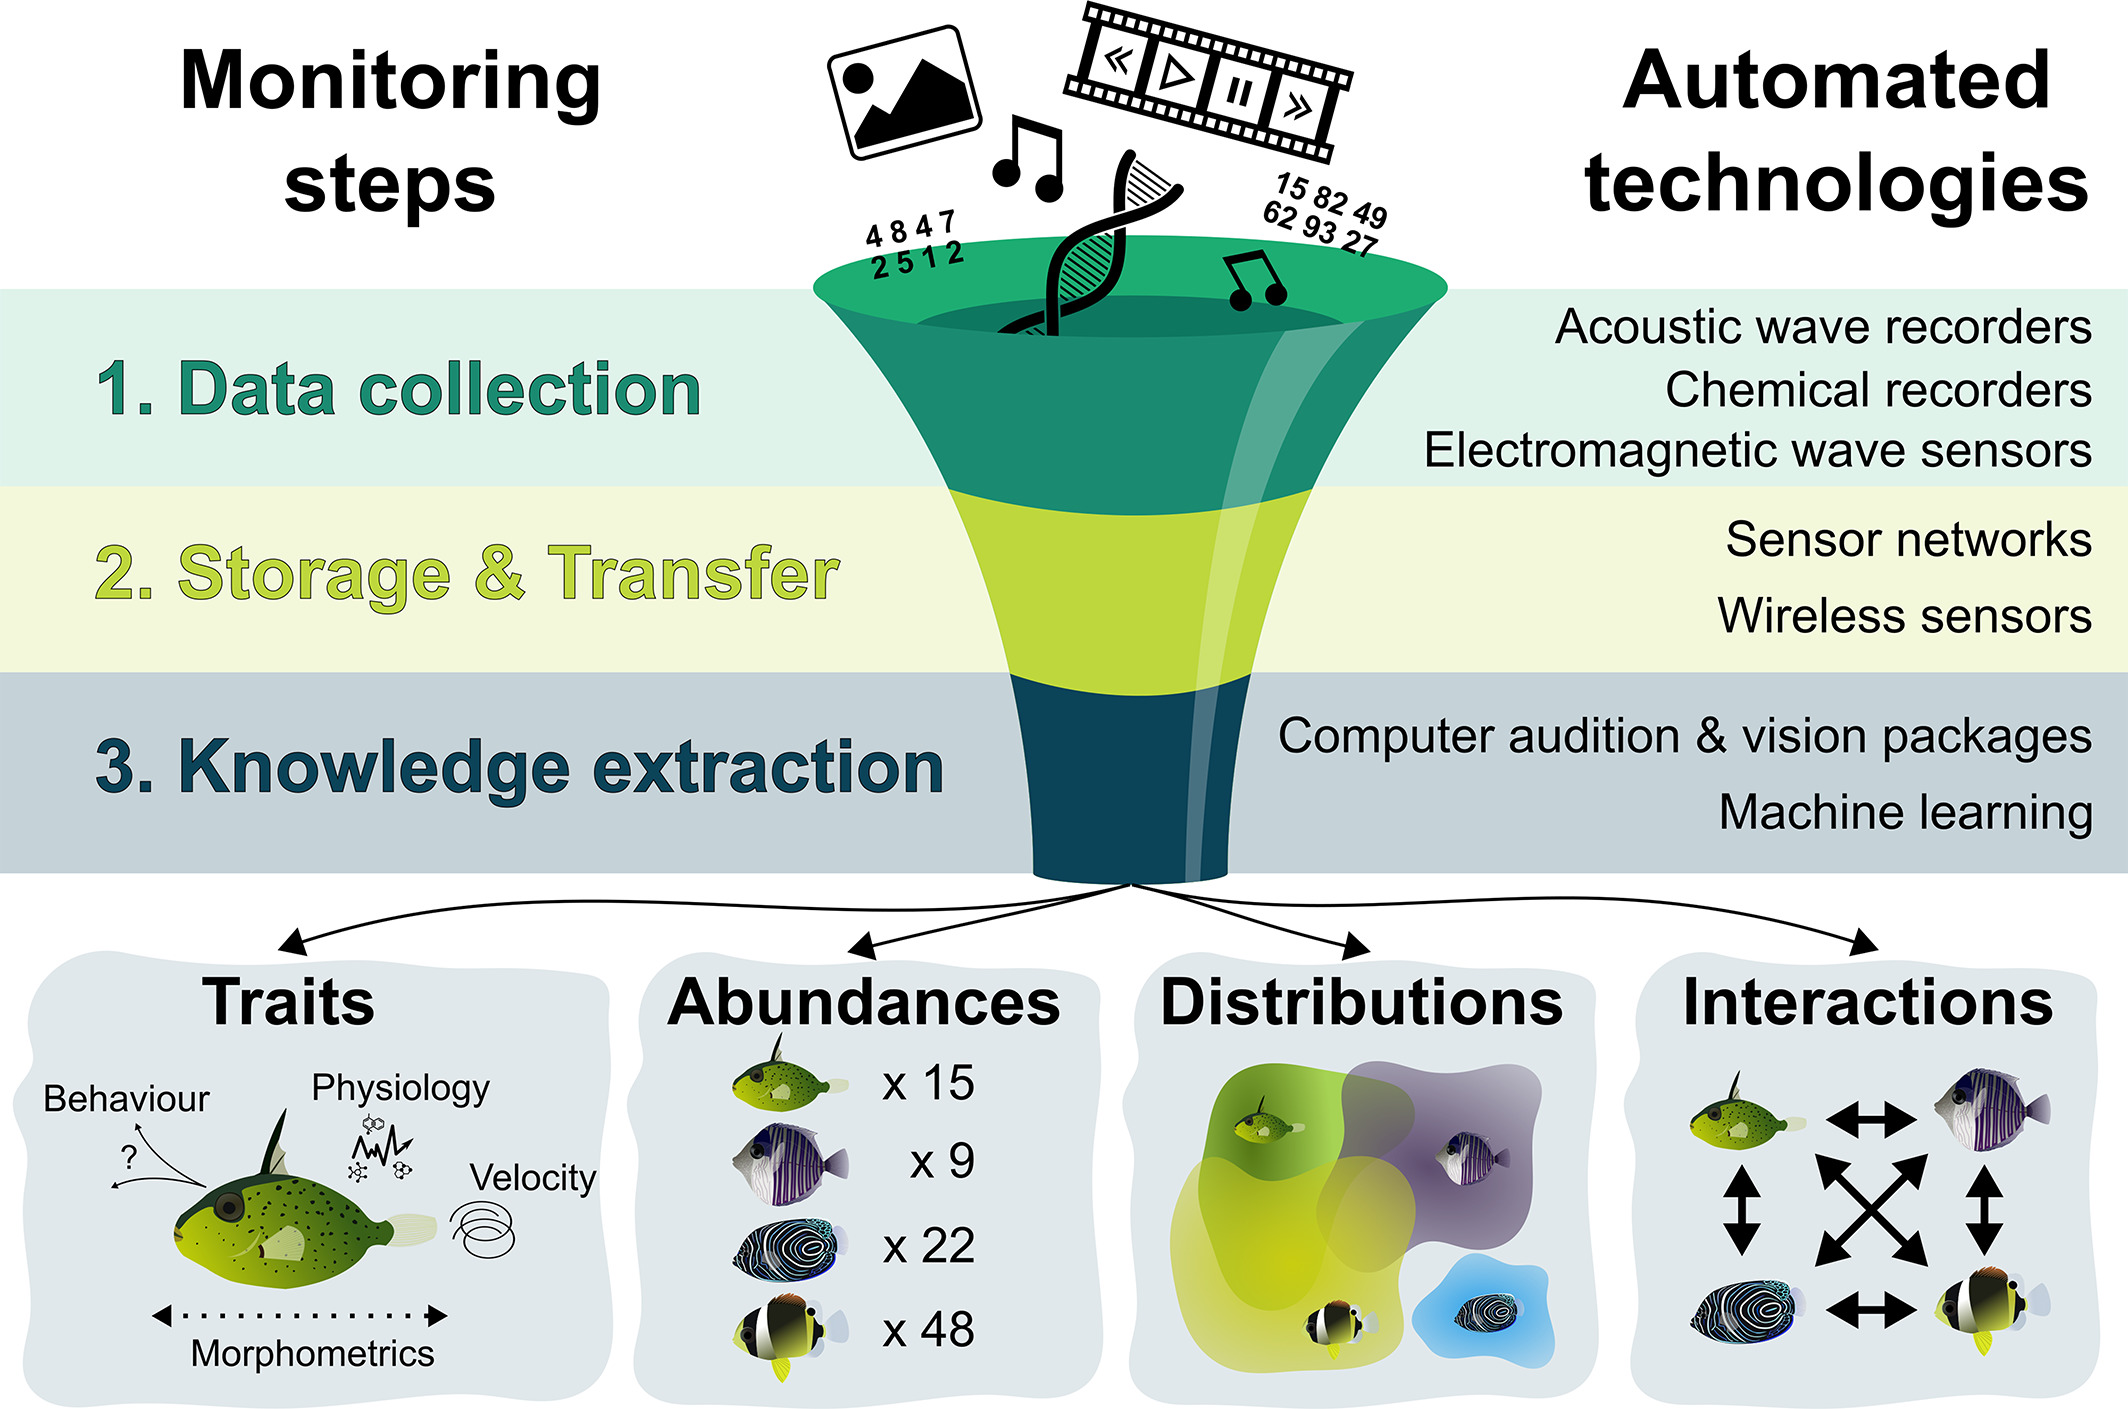
Biodiversity concepts
How to measure biodiversity?
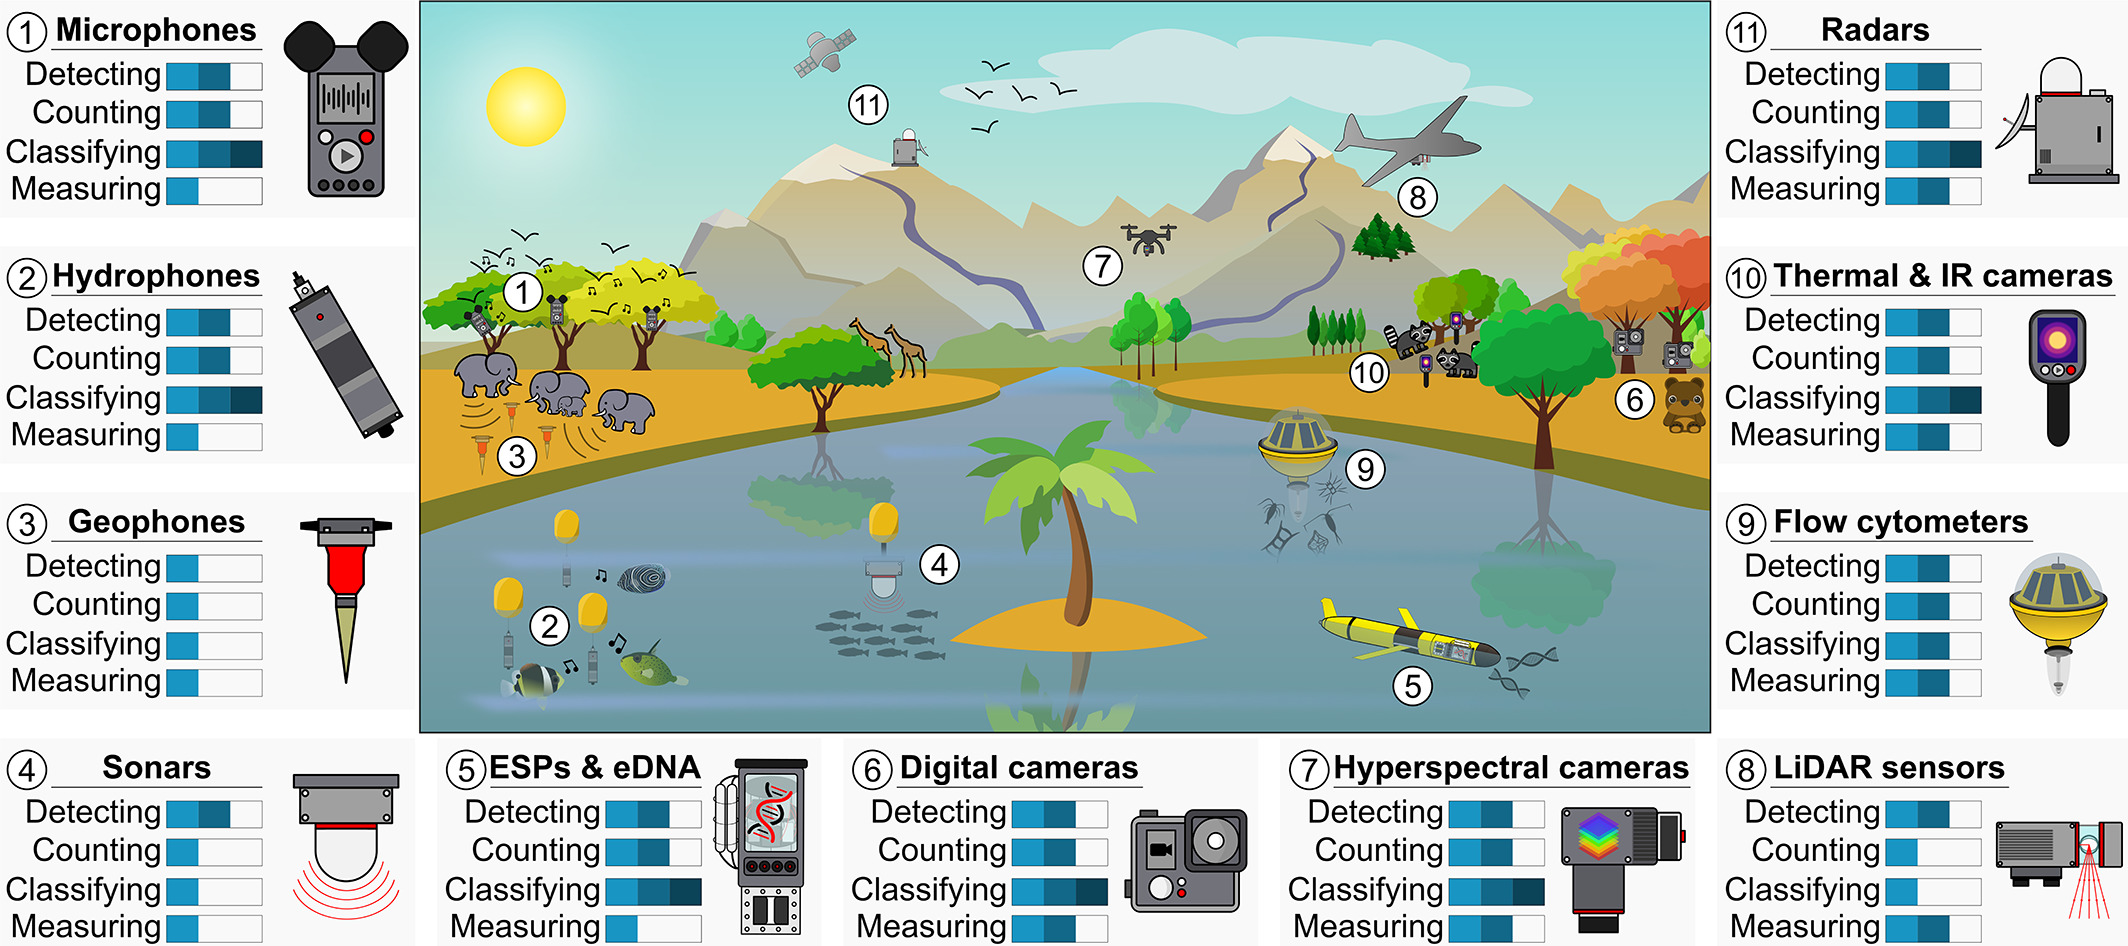
Biodiversity concepts
How to measure biodiversity?

Why do we want so much to measure biodiversity?
Biodiversity concepts
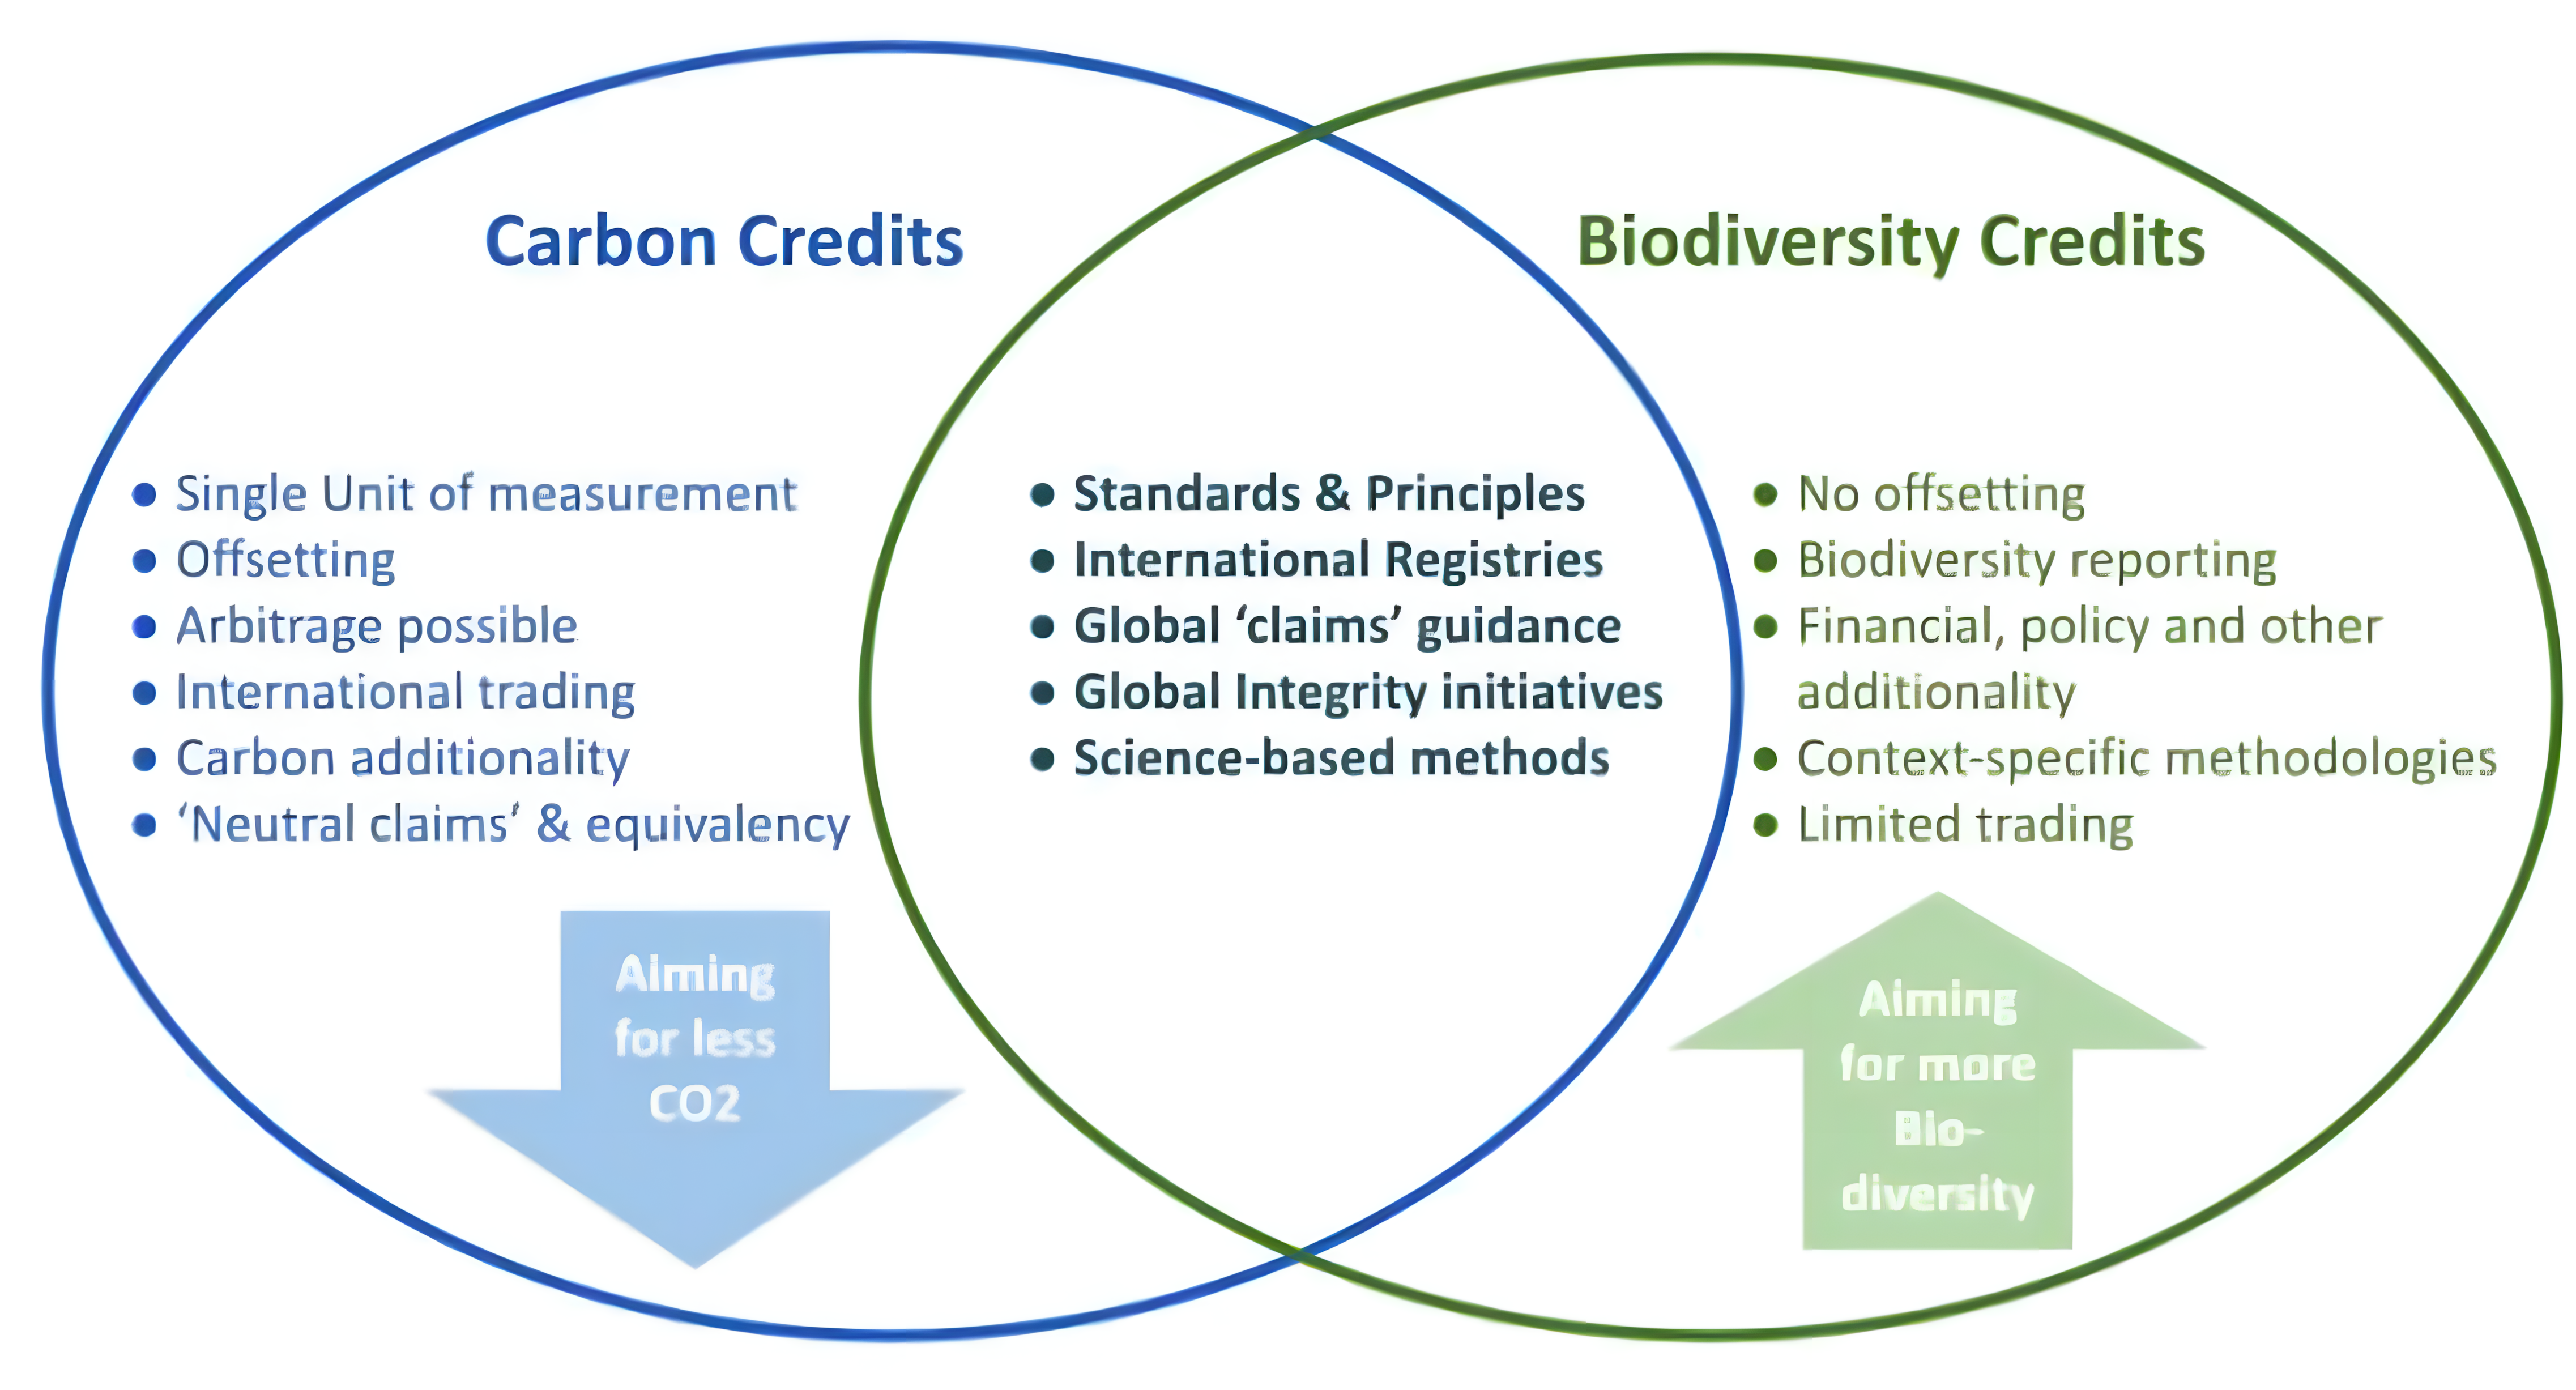
Carbon credit
- Allows private companies to trade carbon emissions
- Measured in tonnes of carbon dioxide equivalent (tCO2e)
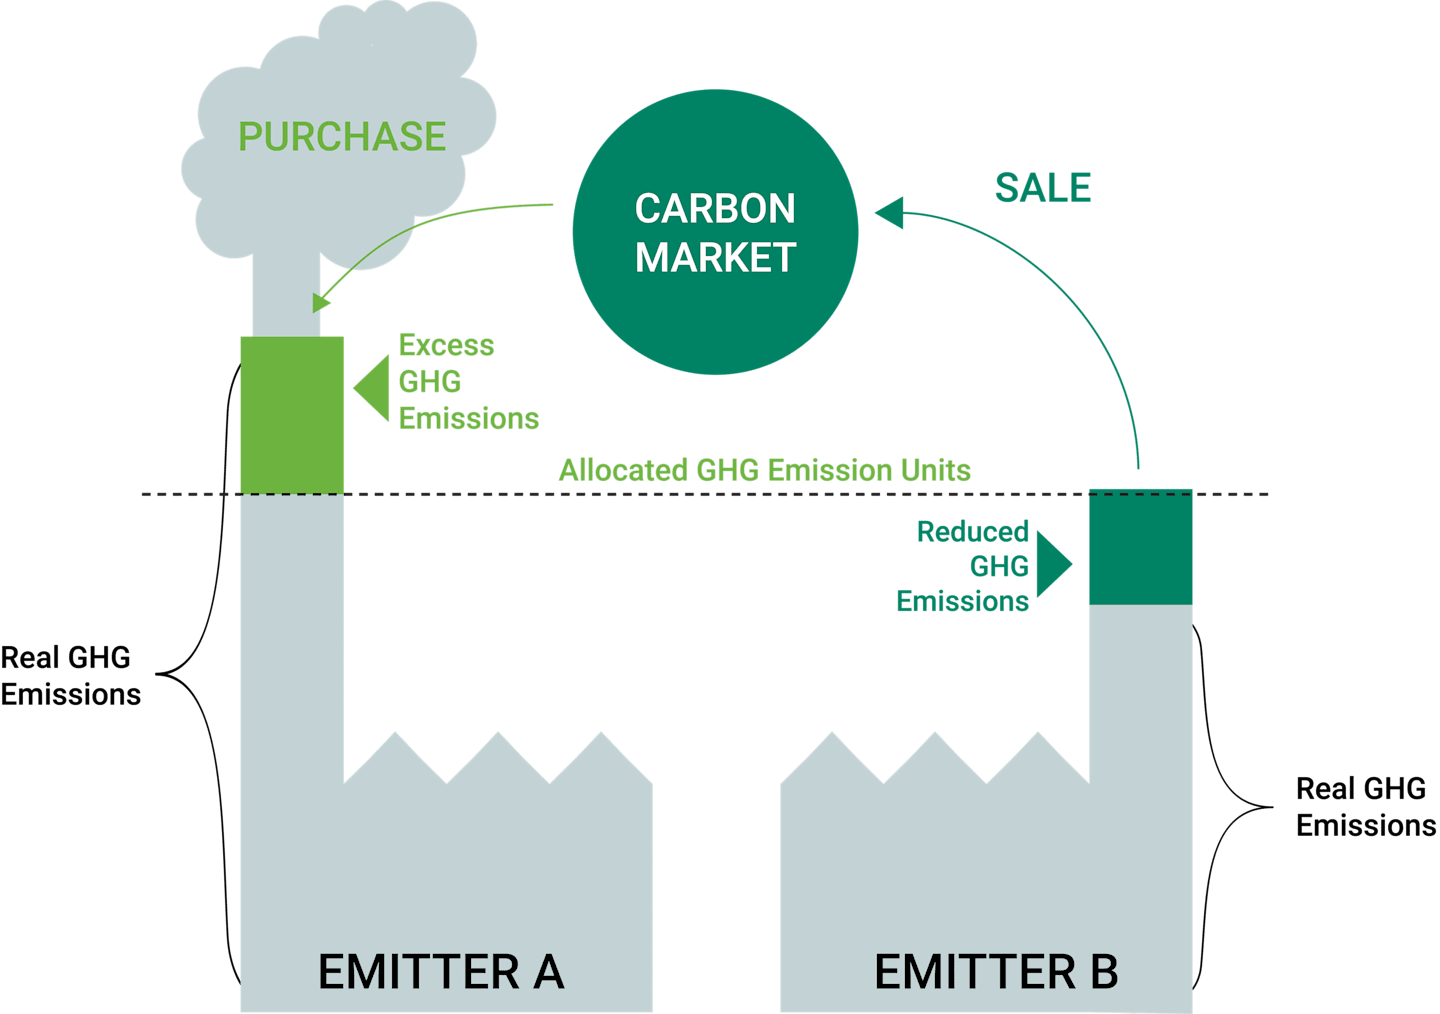
Biodiversity concepts
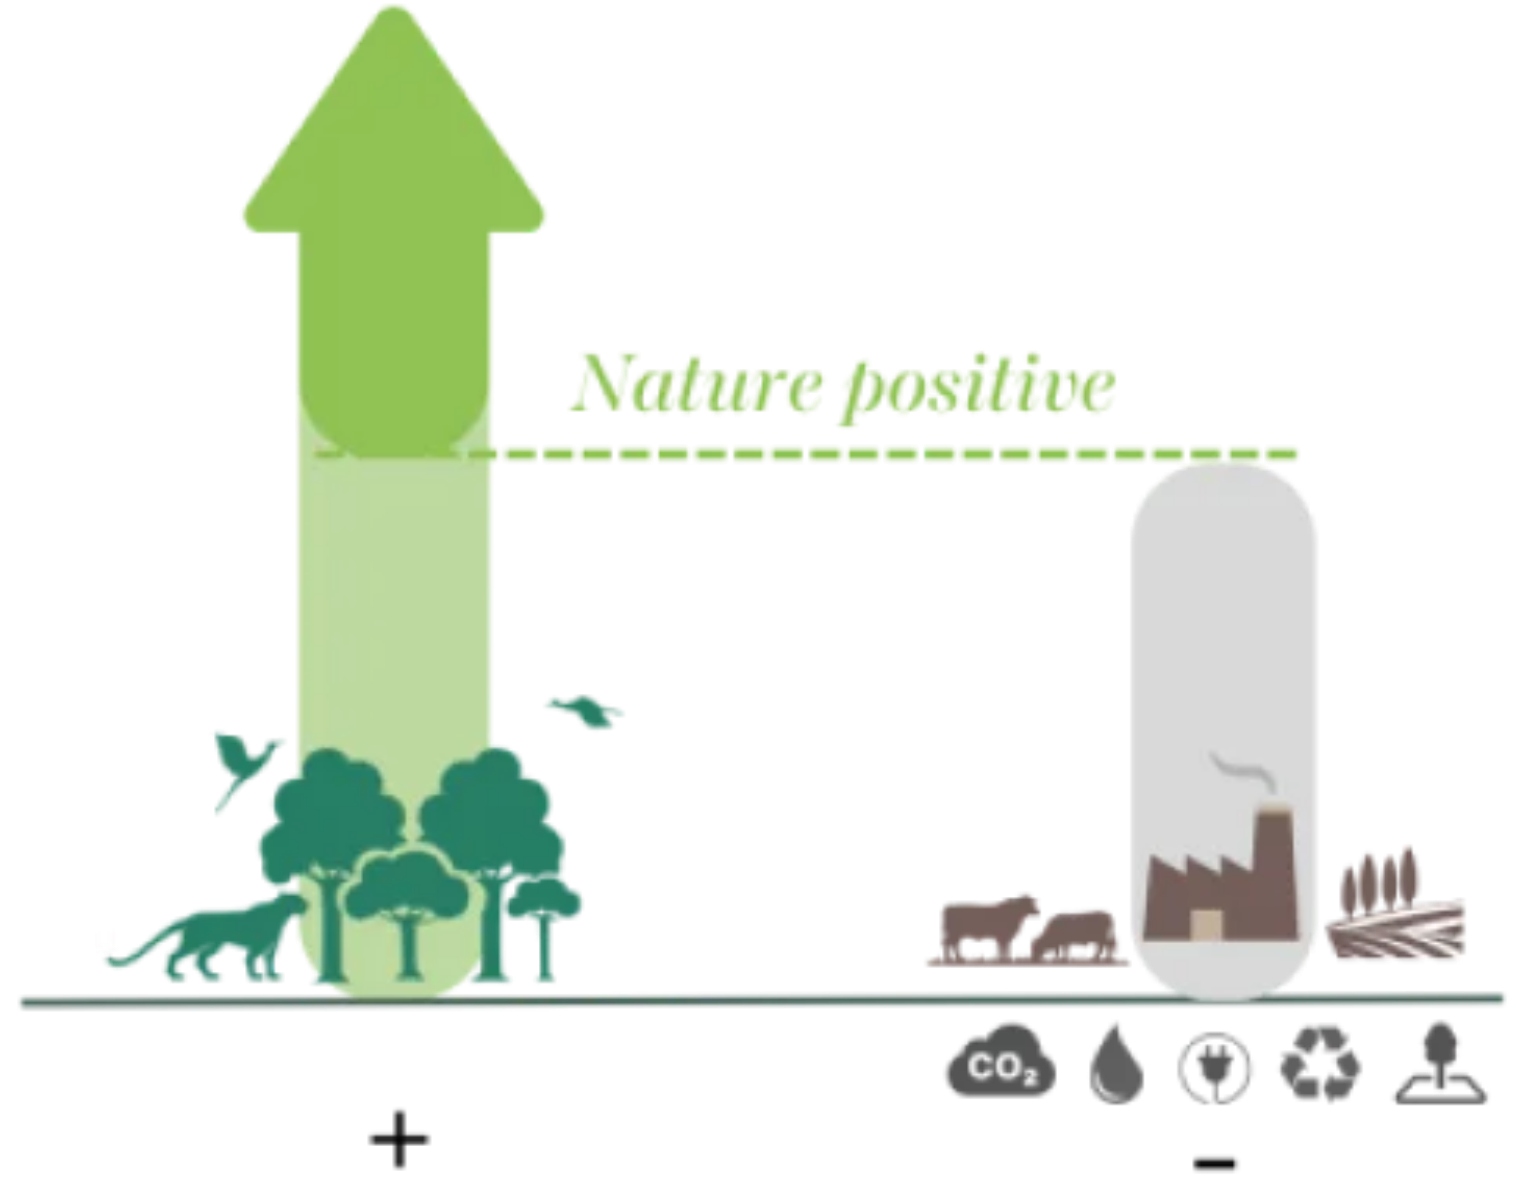
Biodiversity credit
- Allows private companies to finance activities (e.g. forest conservation or restoration) for positive biodiversity gains
Biodiversity concepts
Carbon credit vs Biodiversity credit
There is a small problem: we do not know all the biodiversity……
Biodiversity concepts
Seven biodiversity shortfalls
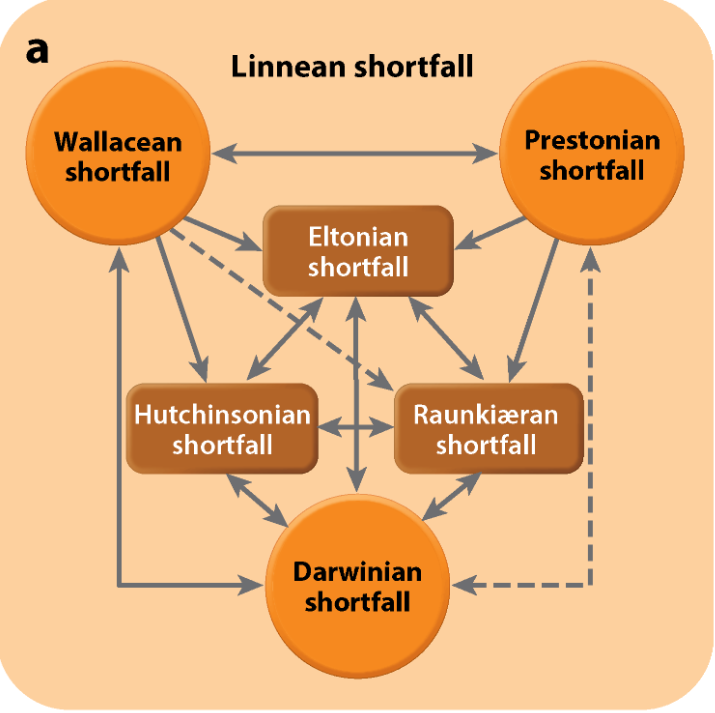
- Species taxonomy (Linnean)
- Species distribution (Wallacean)
- Species abundance (Prestonian)
- Species evolutionary patterns (Darwinian)
- Species abiotic tolerances (Hutchinsonian)
- Species traits (Raunkiæran)
- Species biotic interactions (Eltonian)
Biodiversity concepts
Let’s select a biodiversity shortfall to explore

- Species taxonomy (Linnean)
- Species distribution (Wallacean)
- Species abundance (Prestonian)
- Species evolutionary patterns (Darwinian)
- Species abiotic tolerances (Hutchinsonian)
- Species traits (Raunkiæran)
- Species biotic interactions (Eltonian)
Species occurrences
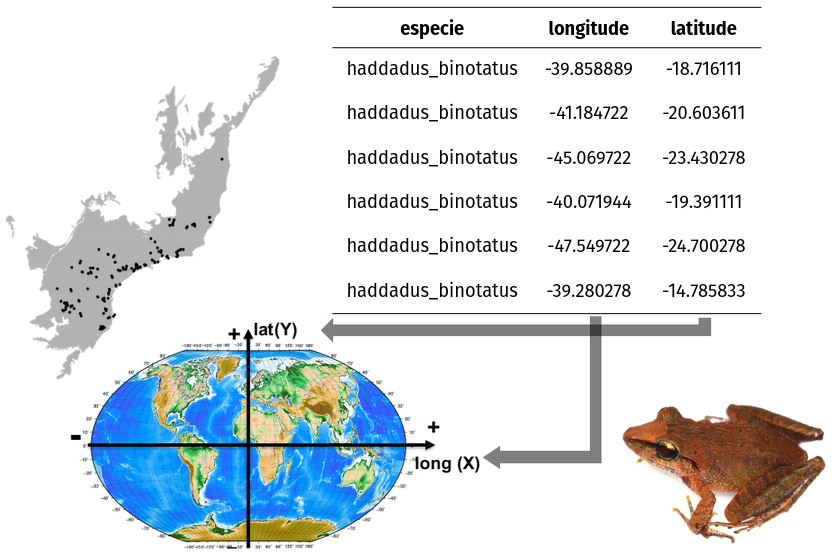
Format
Species occurrences
Sources
- Field collections (field sampling)
- Literature (articles, data papers, …)
- Citizen science (e-Bird, iNaturalist, …)
- Scientific collections and museums (National Museum of Brazil, Royal Botanic Gardens - Kew, …)
- Databases (GBIF, speciesLink, VertNet, …)
Species occurrences
Databases

Species occurrences
R packages
Species occurrences
spocc
- Global Biodiversity Information Facility (GBIF) (
rgbif): Earth’s biodiversity - iNaturalist (
inat): citizen science data on species observations - VertNet (
rvertnet): vertebrate records from institutions and museums - eBird (
rebird): citizen science data on bird abundance and distribution and checklist - iDigBio (
ridigbio): biological and paleobiological specimens - Ocean Biogeographic Information System (OBIS) (
obis): marine species data sets from all of the world’s oceans - Atlas of Living Australia (ALA)(
ala): information about species in Australia
There is another huge problem: sampling bias…
Species occurrences
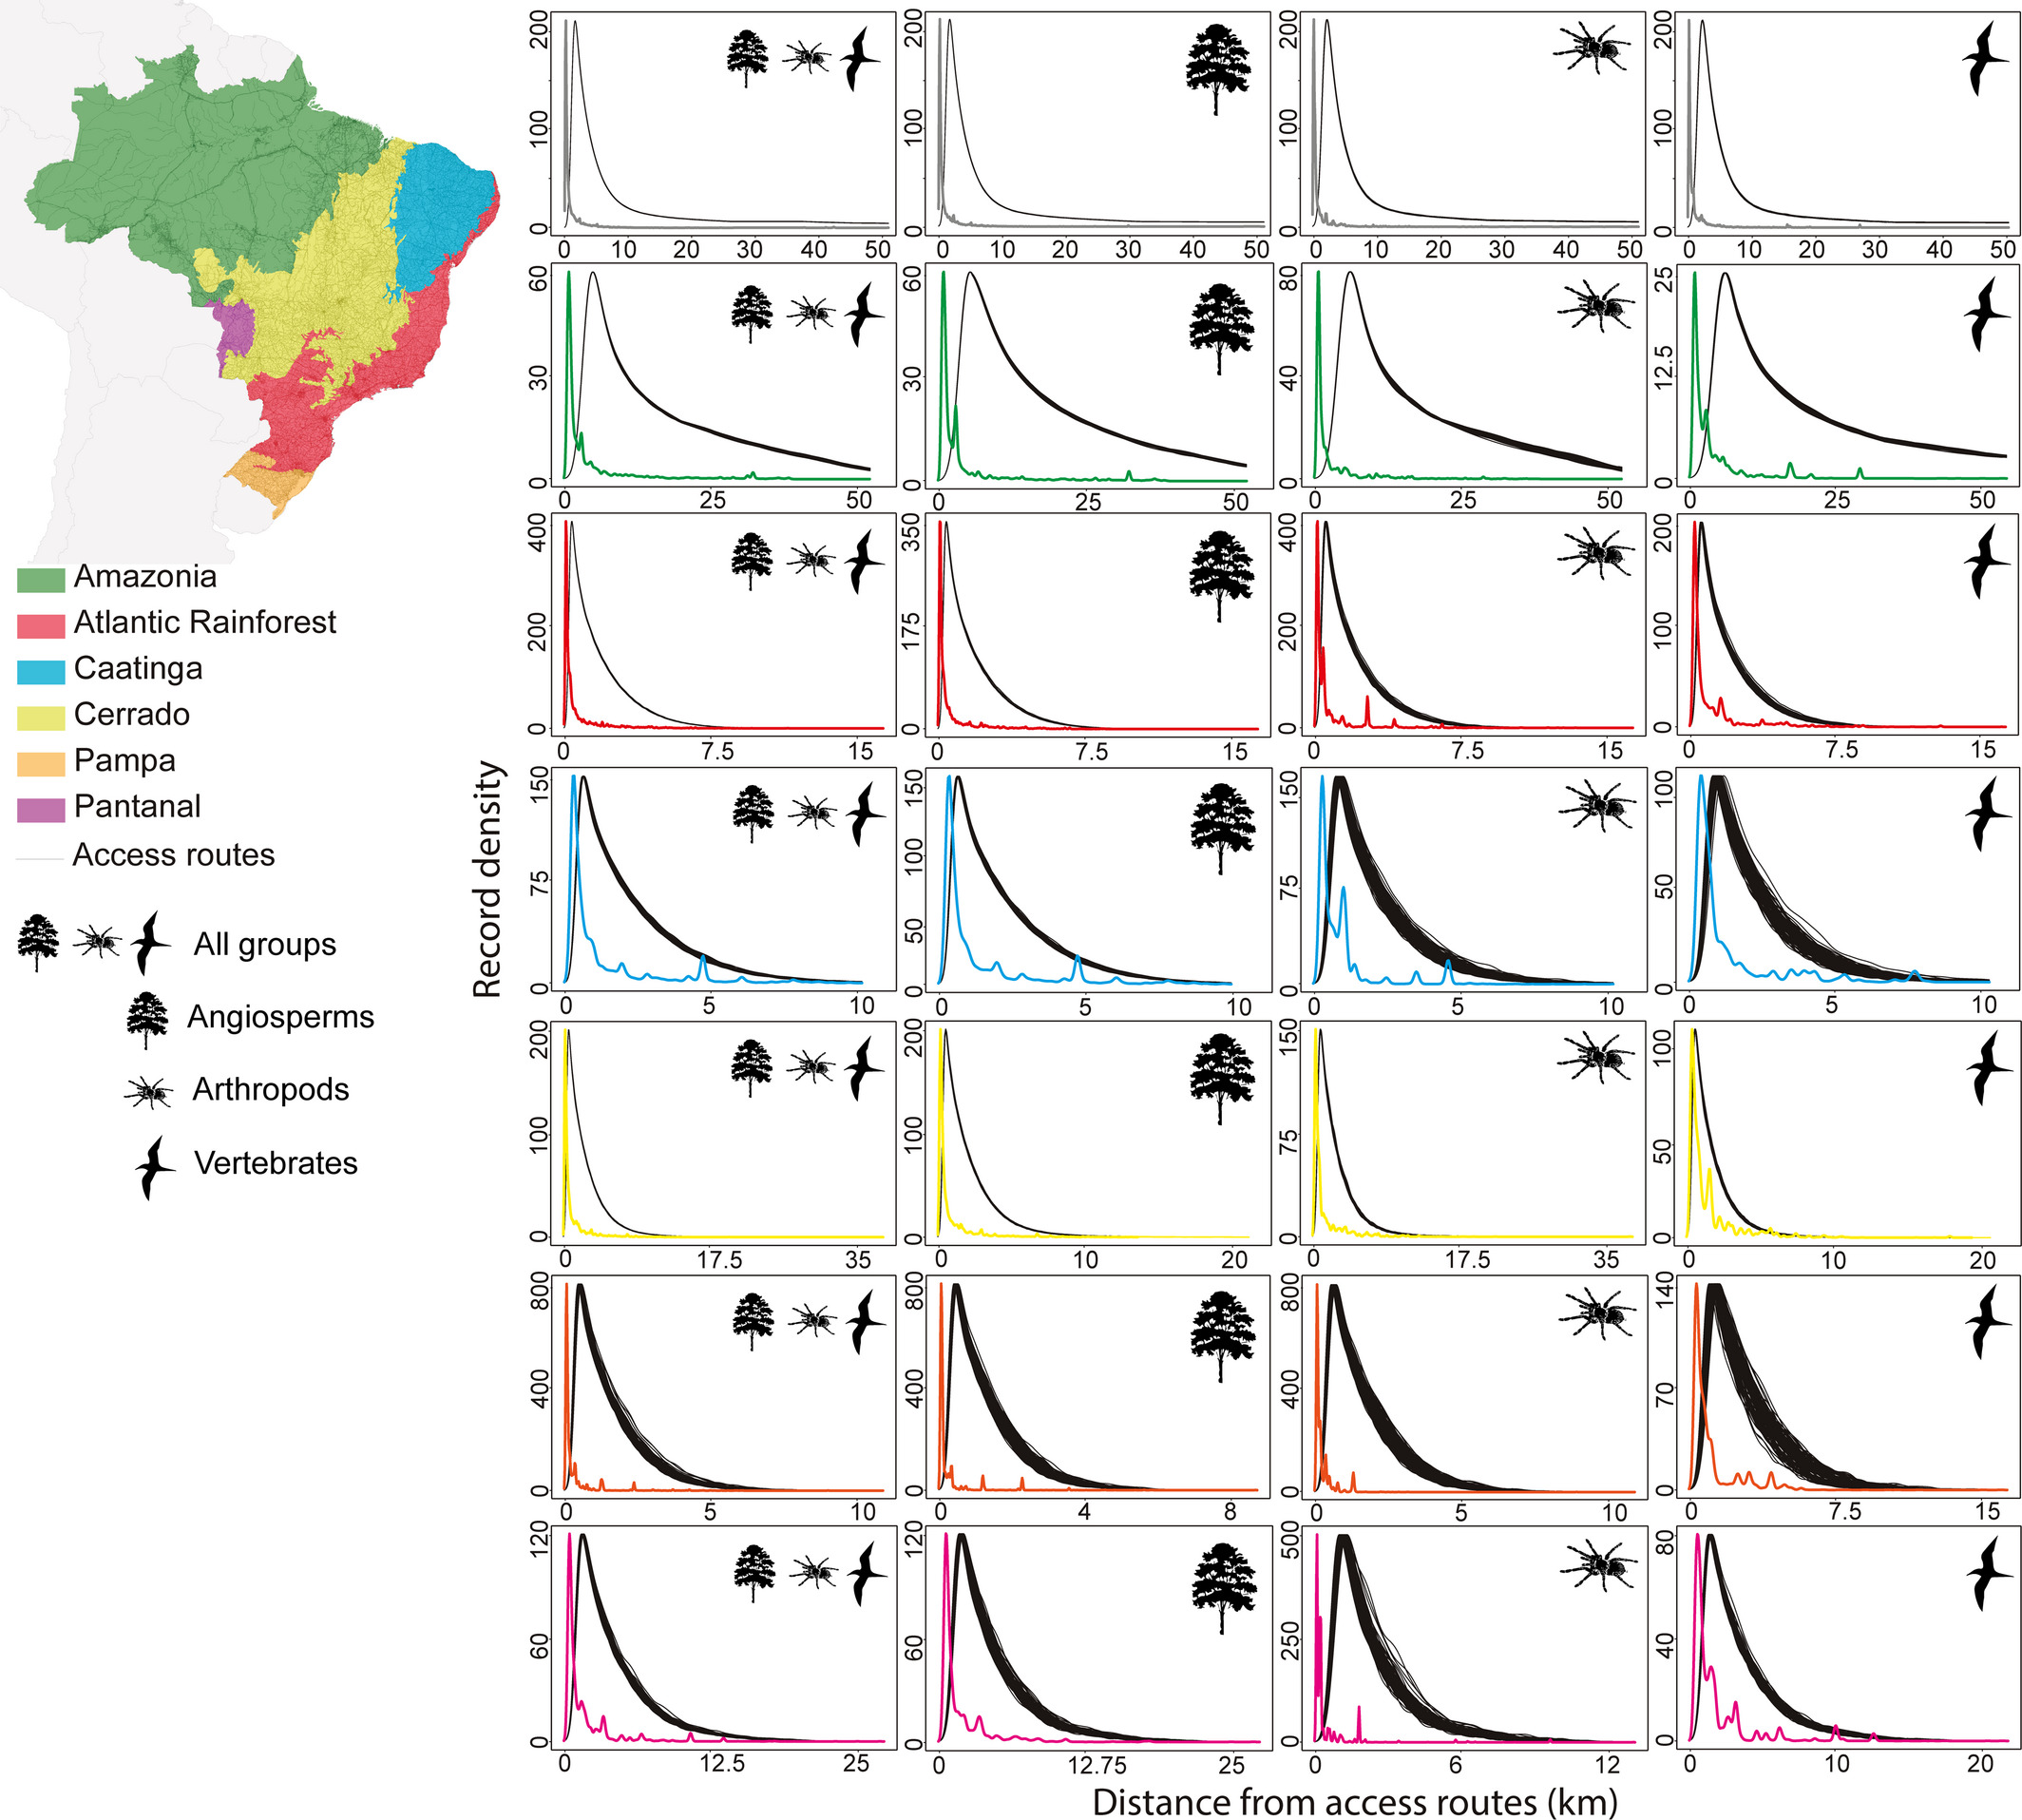
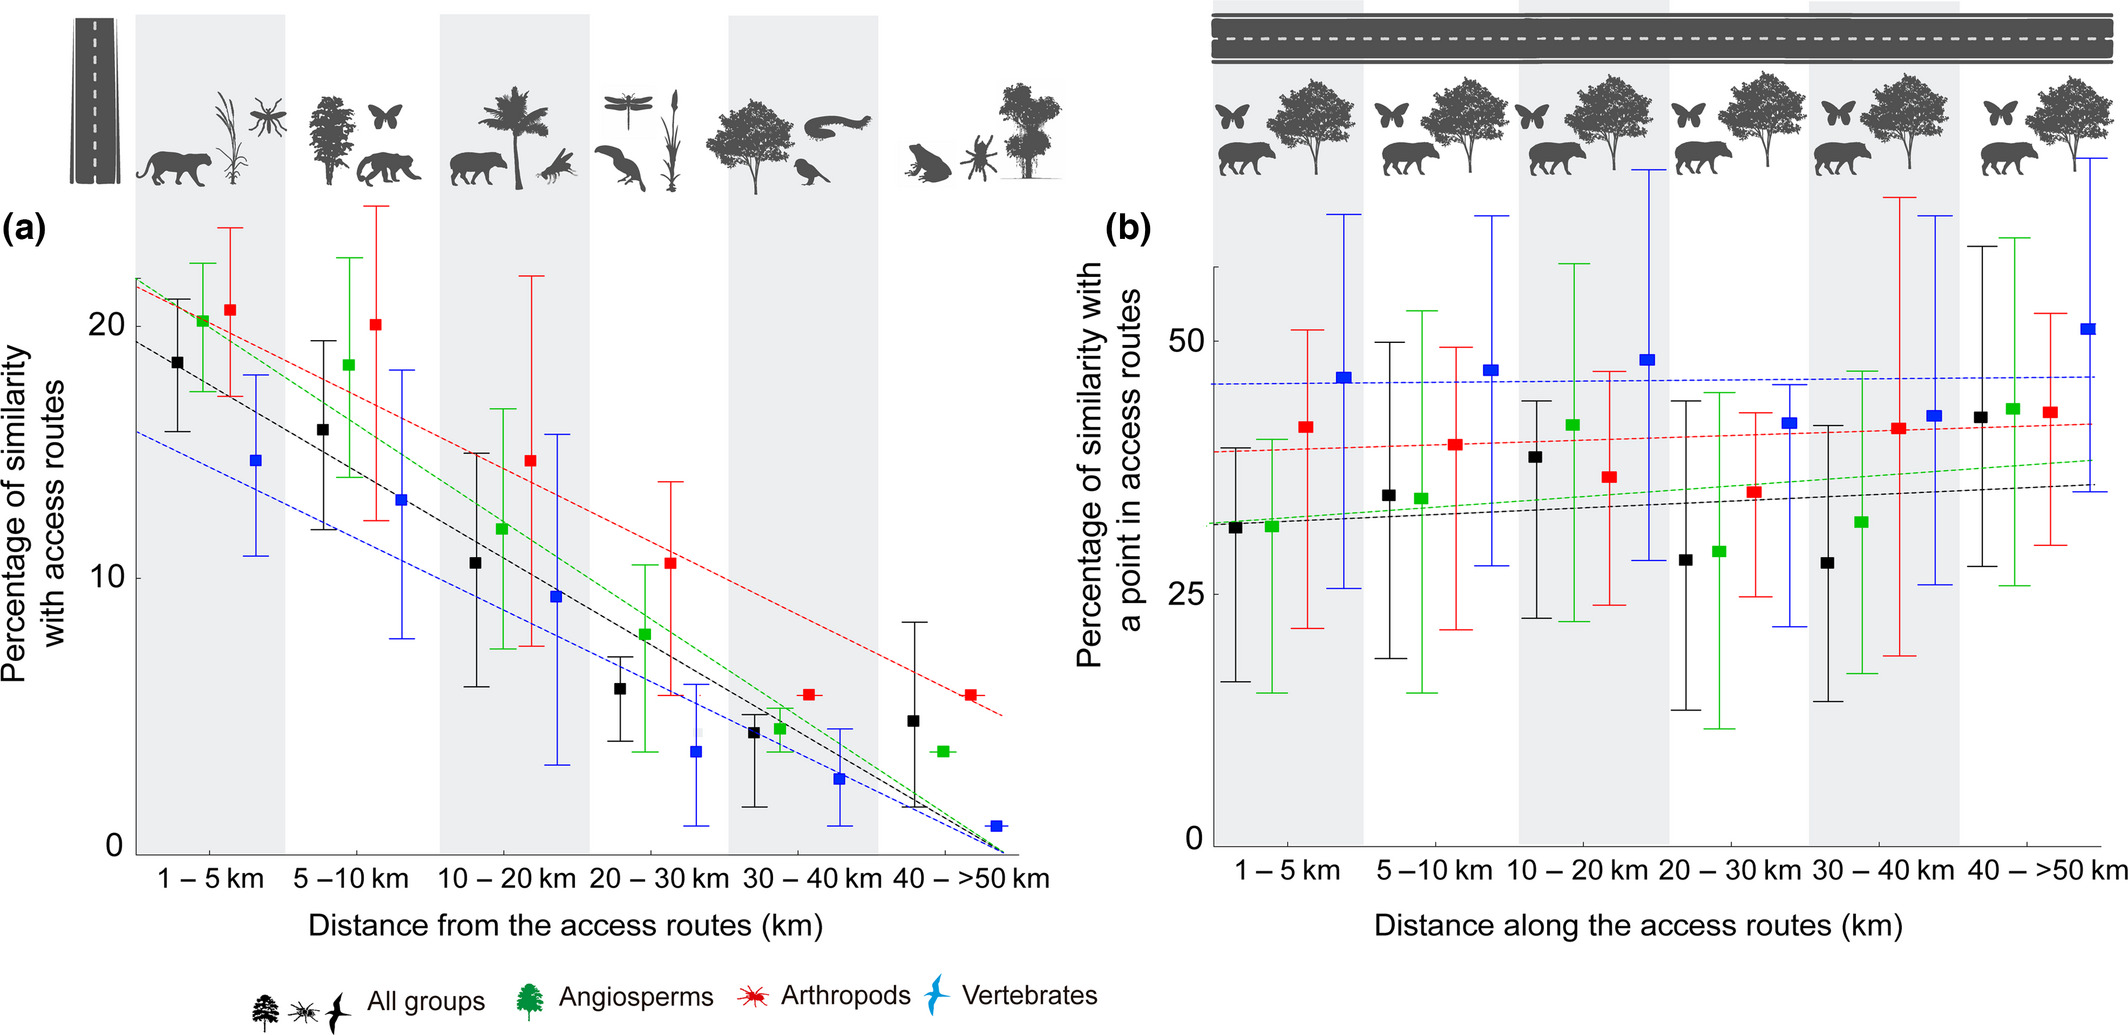
Sampling bias - Brazil
1 million (total) and 900 thousand (valid) occurrences for ~4,500 species
- Groups: vertebrates, arthropods and angiosperms
- All occurrences <1km from access routes (roads and rivers)
Species occurrences
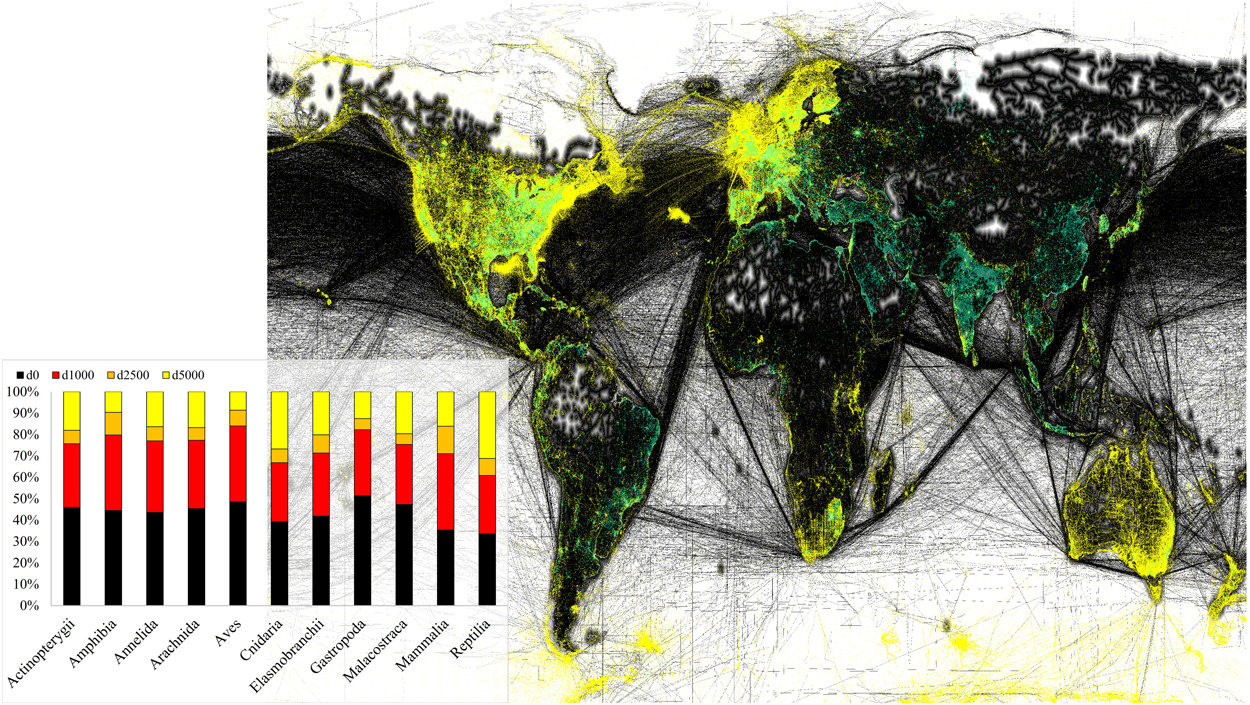
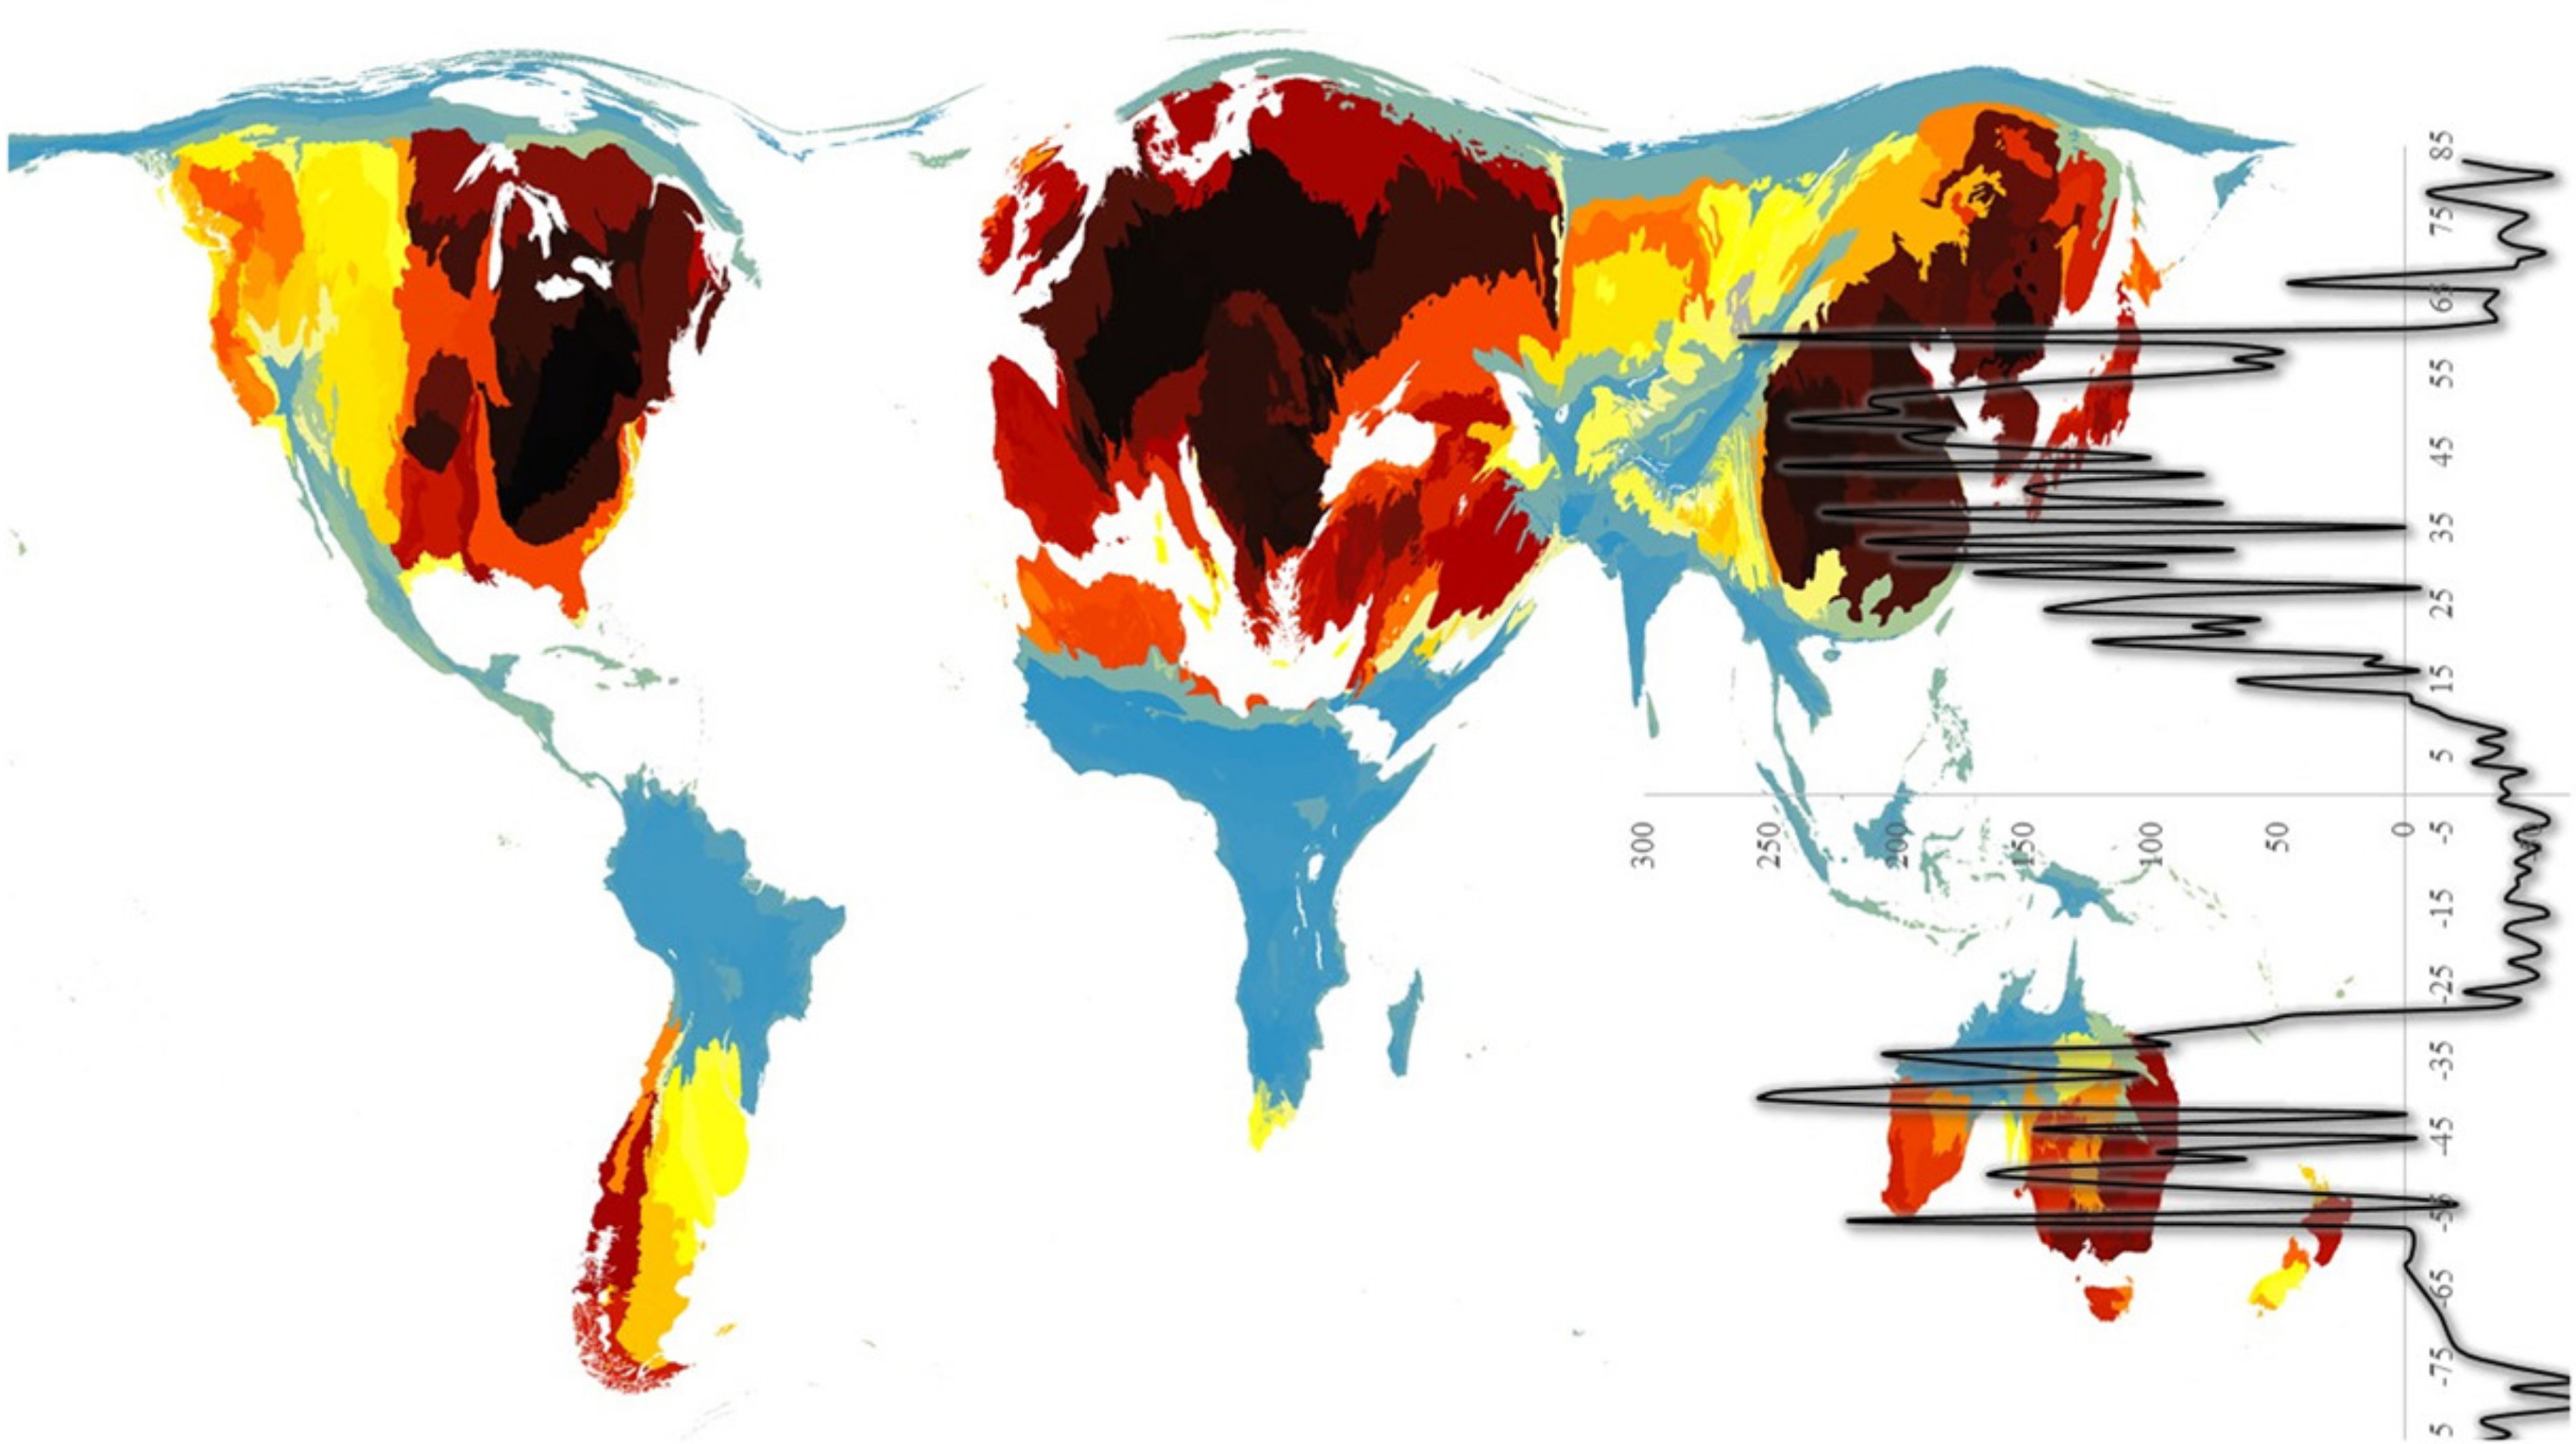
Sampling bias - World
- 740 million occurrences of 375 thousand species
- Representing only 6.7% of the sampled globe
- At least 80% of records were within 2.5 km of roads
Species occurrences
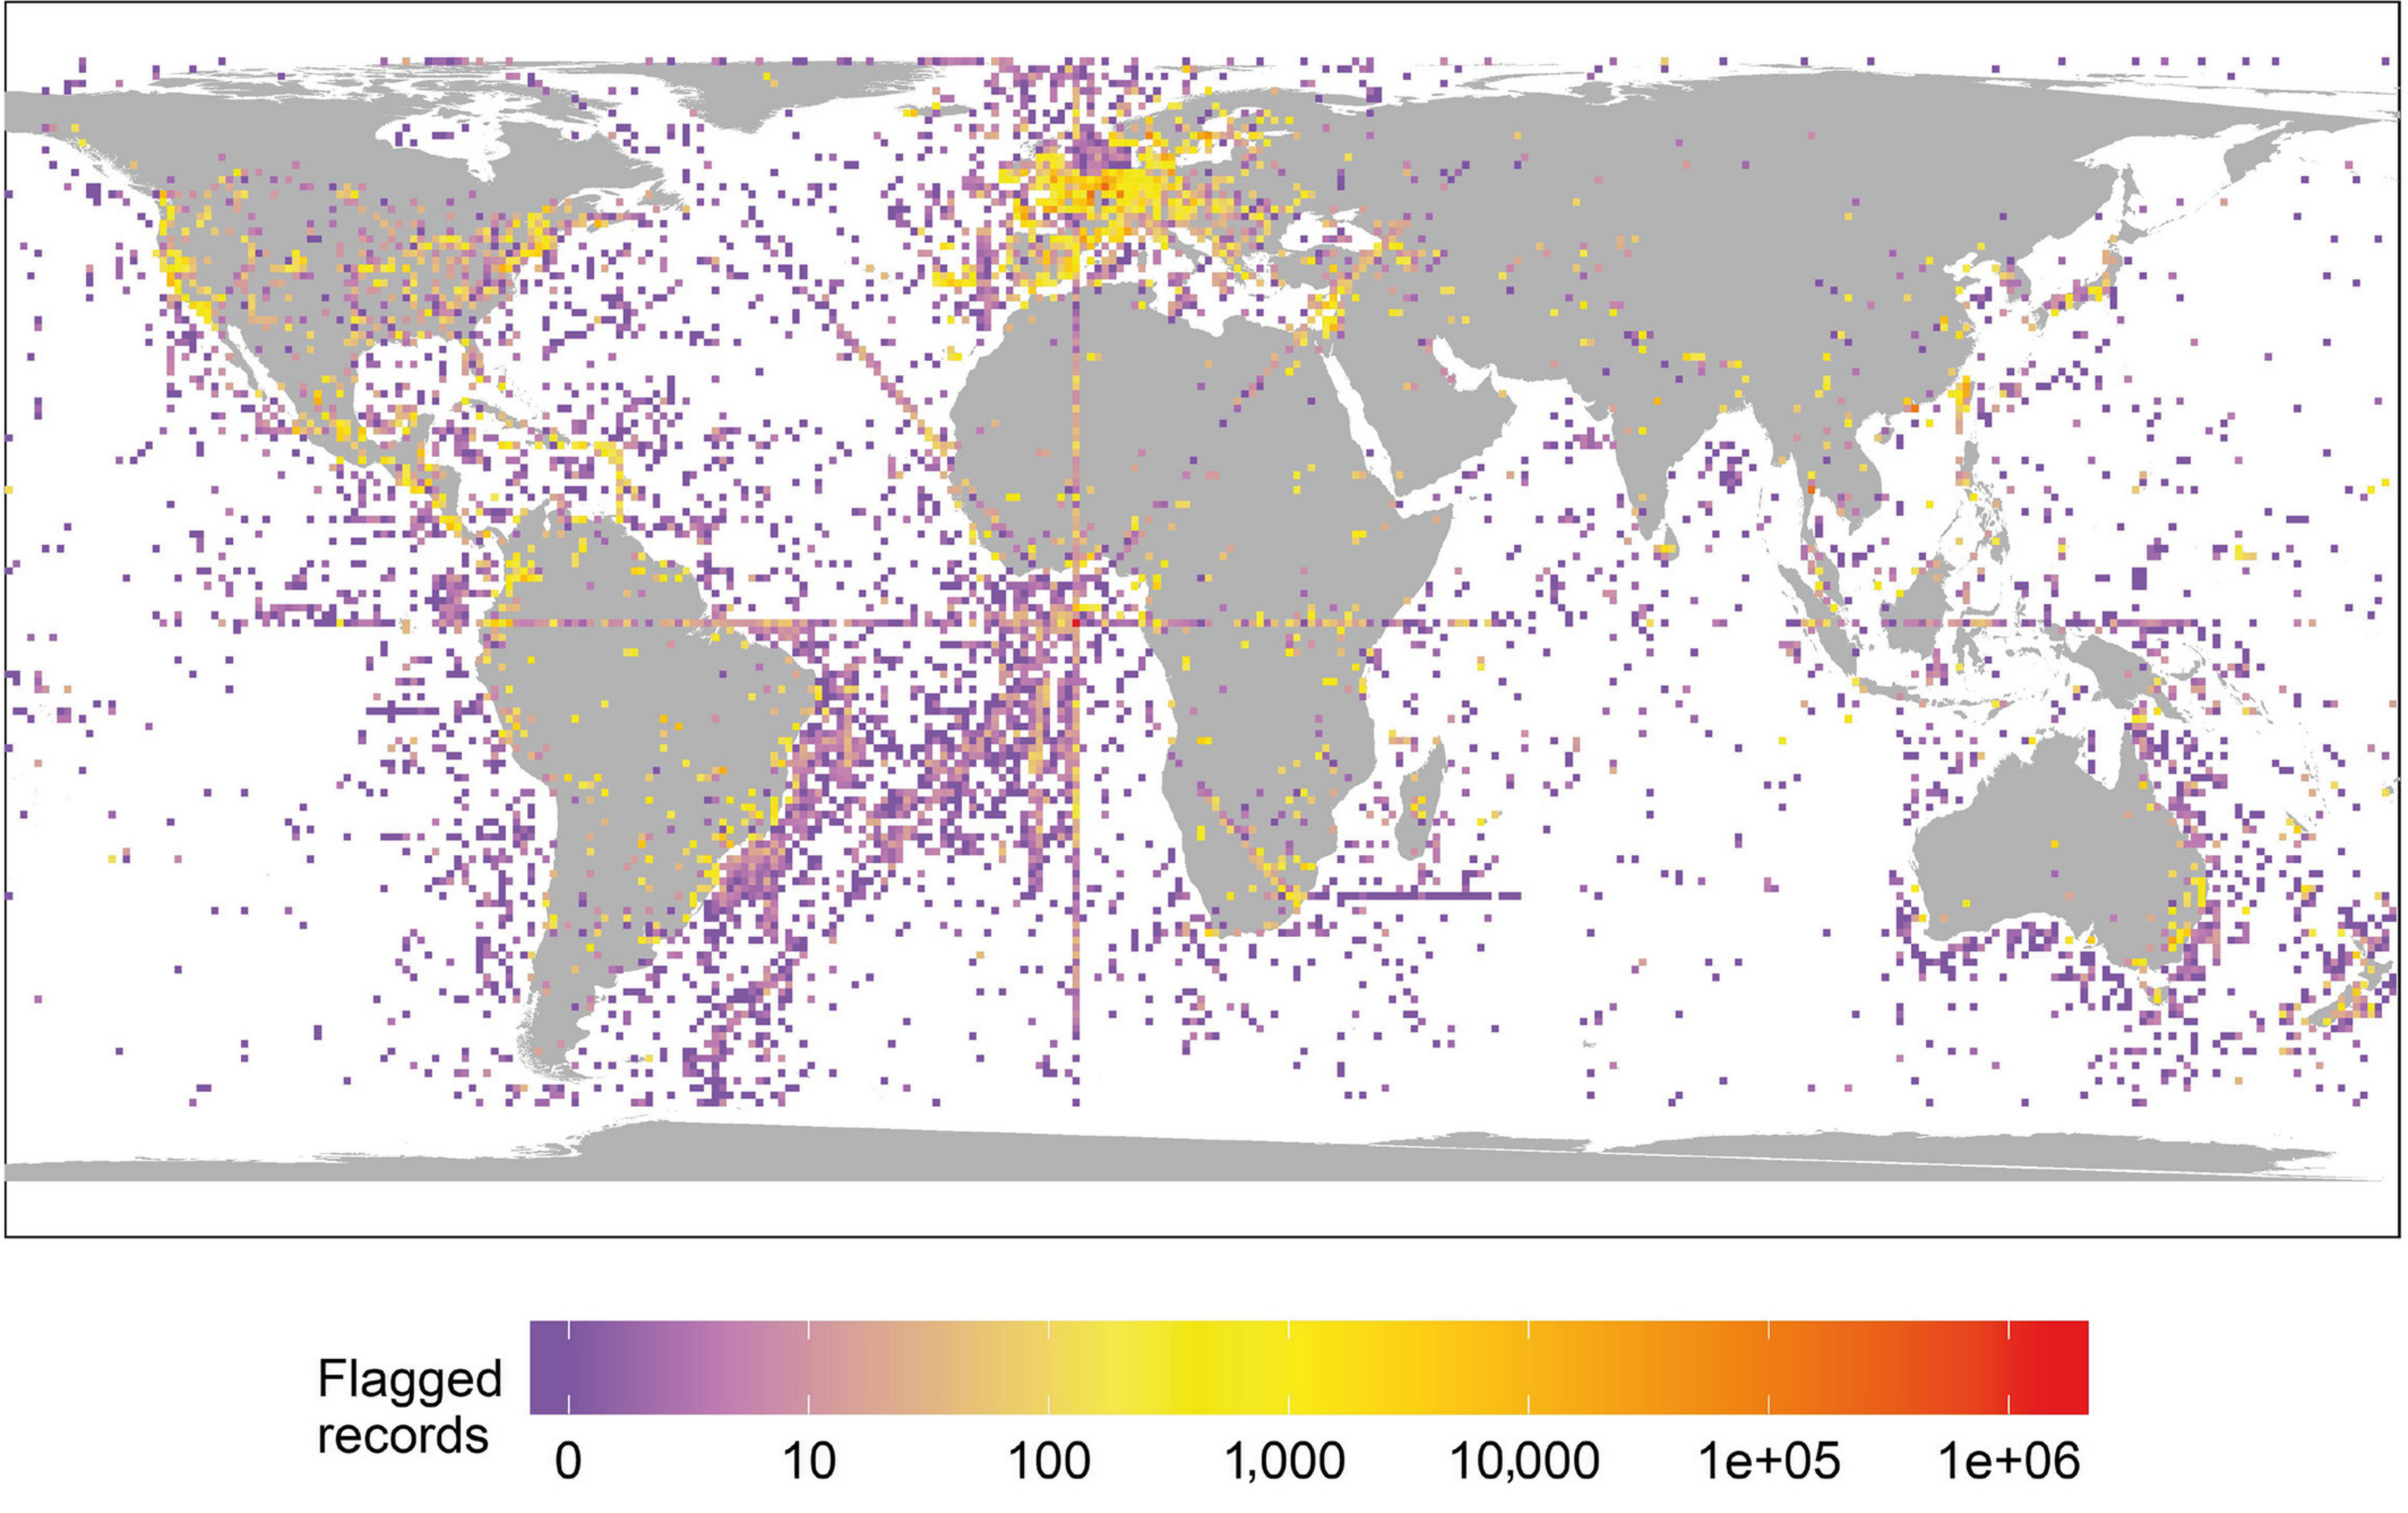
CoordinateCleaner
- Automated flagging of common spatial and temporal errors in species occurrences
- Errors include:
- Country and province centroids
- Capital coordinates
- Coordinates of biodiversity institutions
- Duplicated coordinates per species
- Urban areas
- Seas
- Equal longitude and latitude
Species occurrences
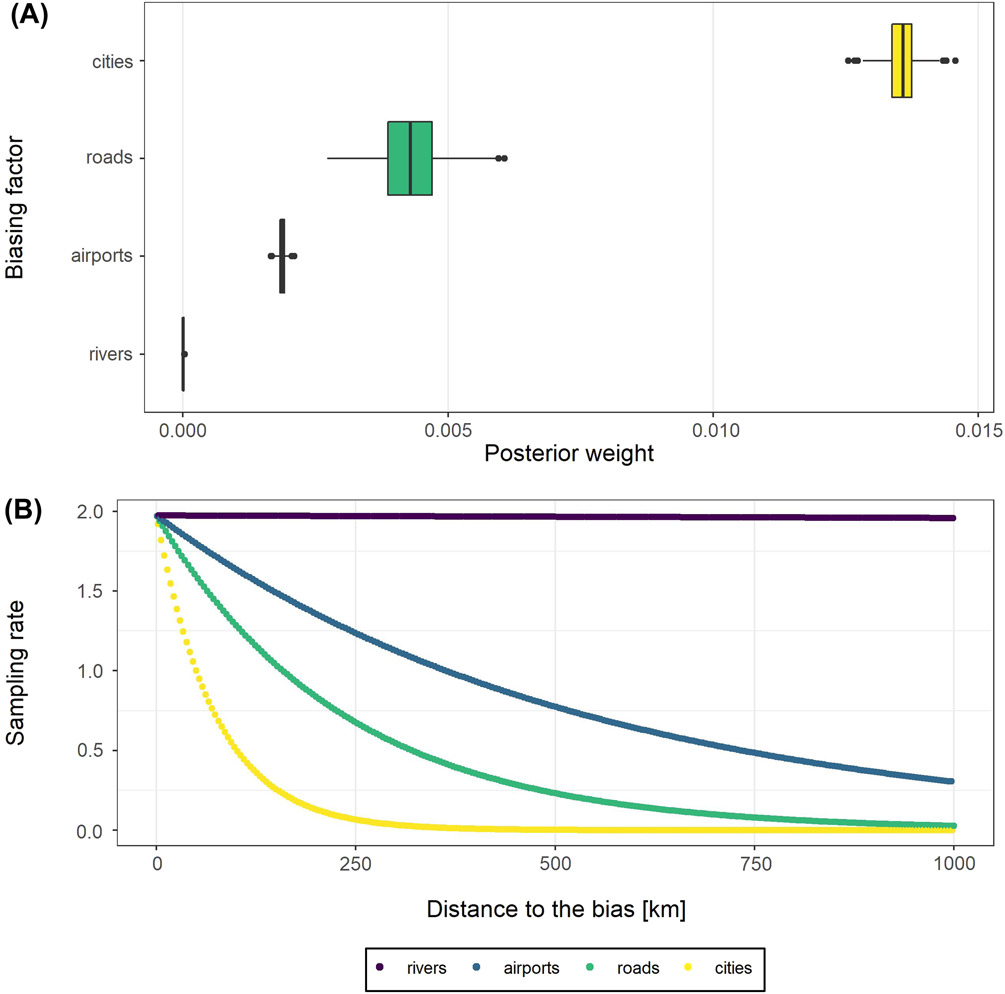
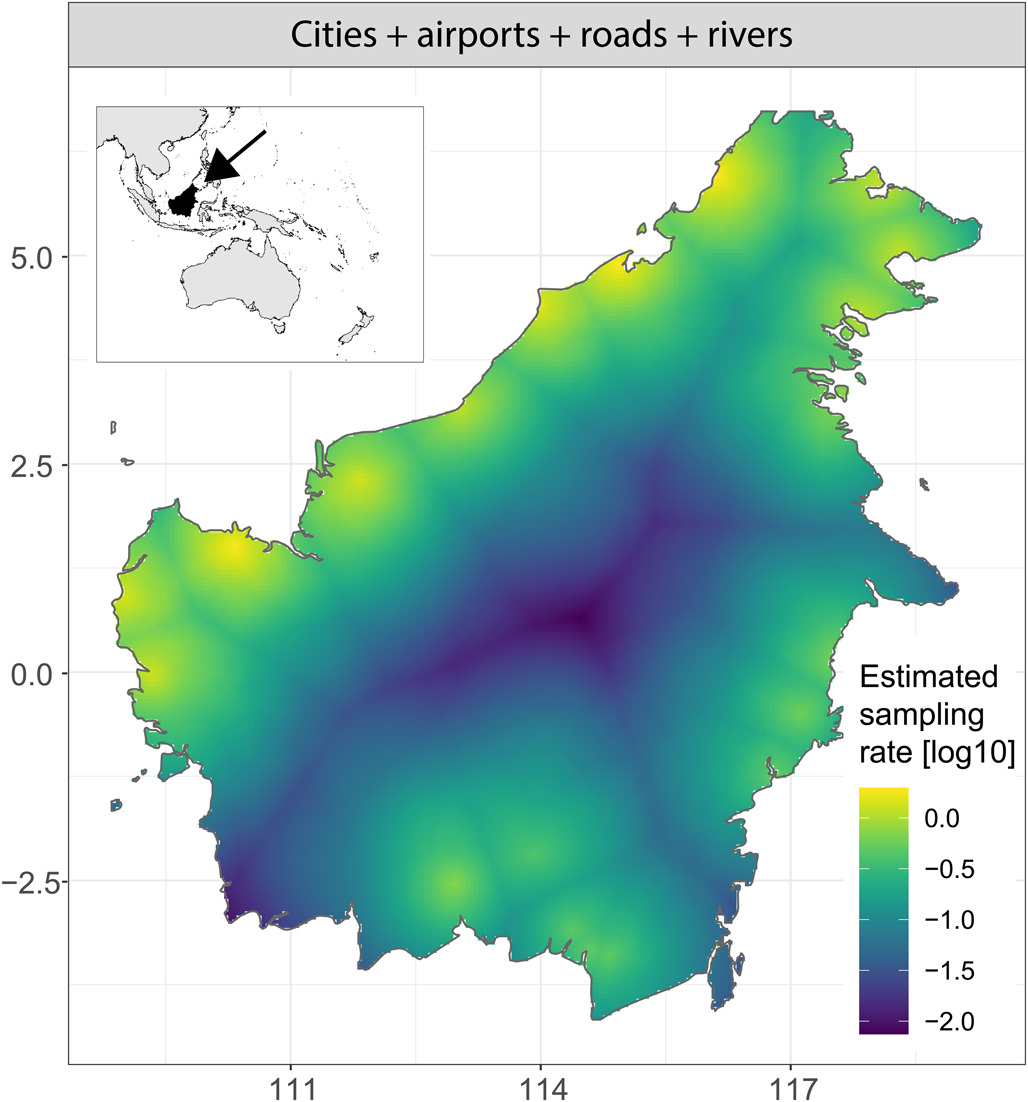
sampbias
- A statistical method to evaluate and visualize geographic sampling biases
- Biases include:
- Cities
- Airports
- Roads
- Rivers
How to analyze this data spatially?
Spatial analysis
Spatial units


Spatial analysis
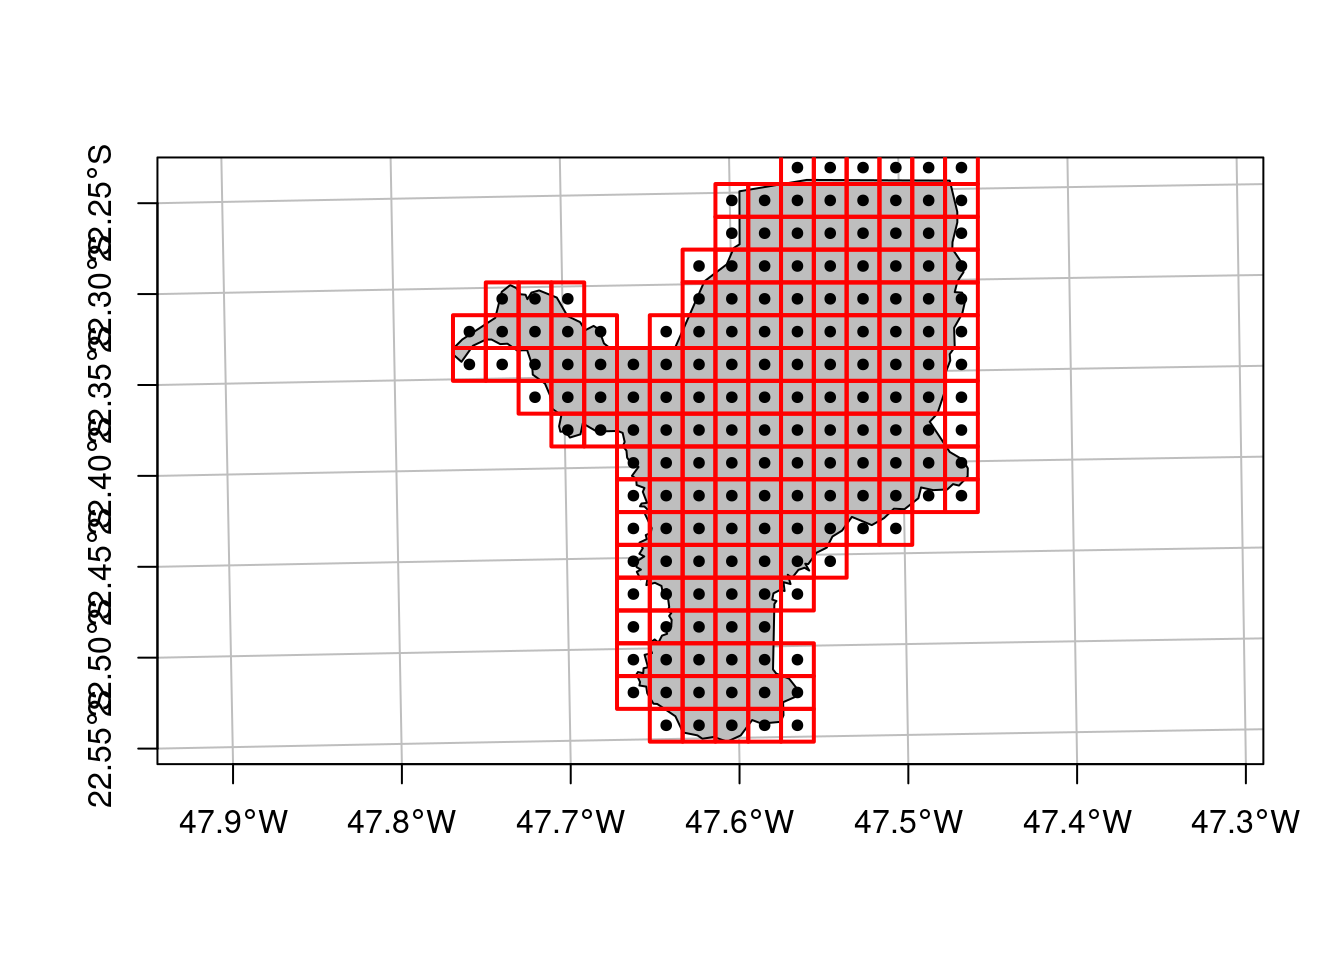
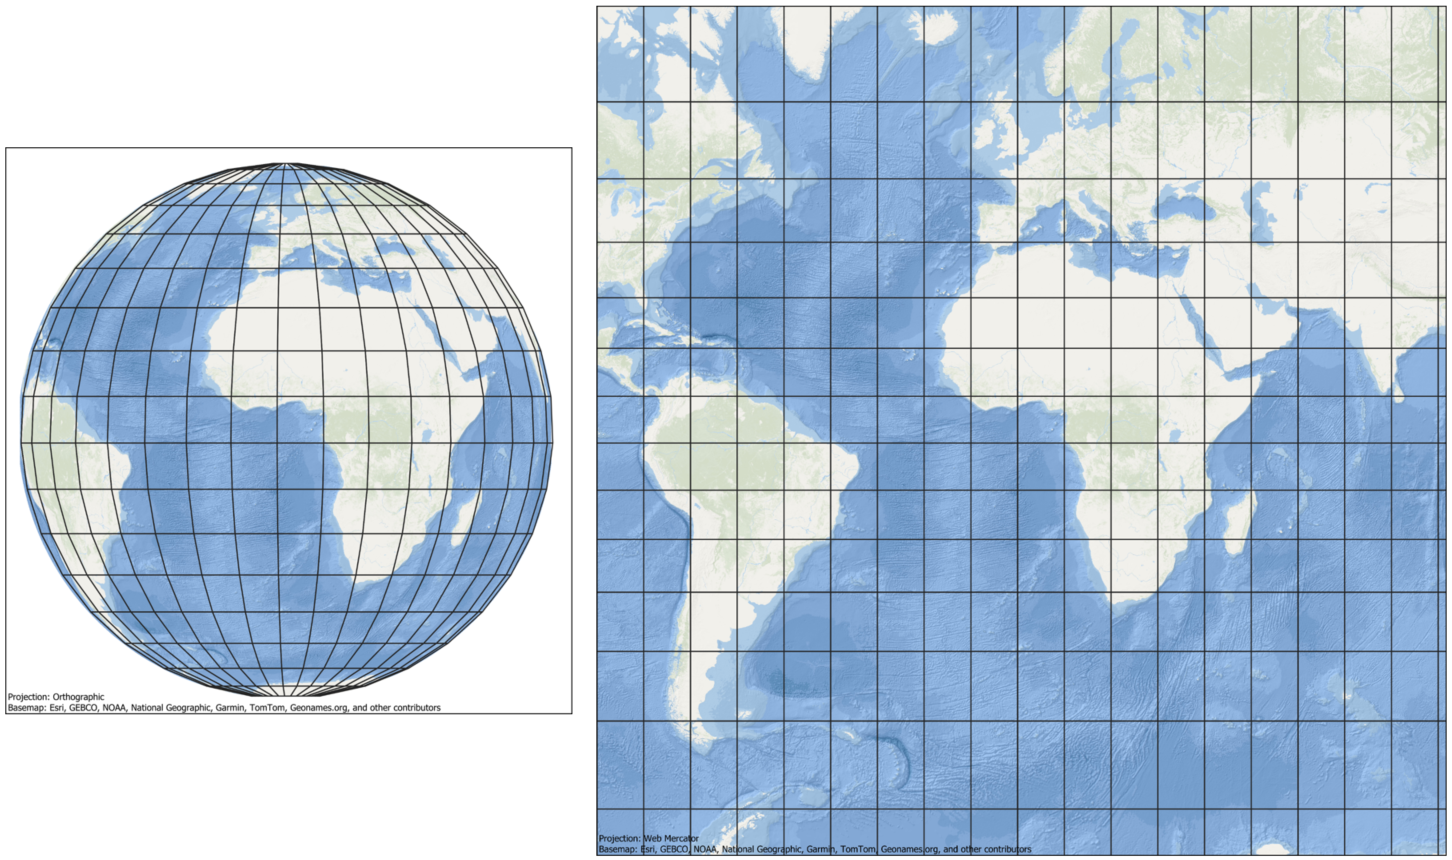
Spatial units - Grids
- Geographic area in regular cells, forming a grid
- Each cell is a spatial unit that contains values
Spatial analysis
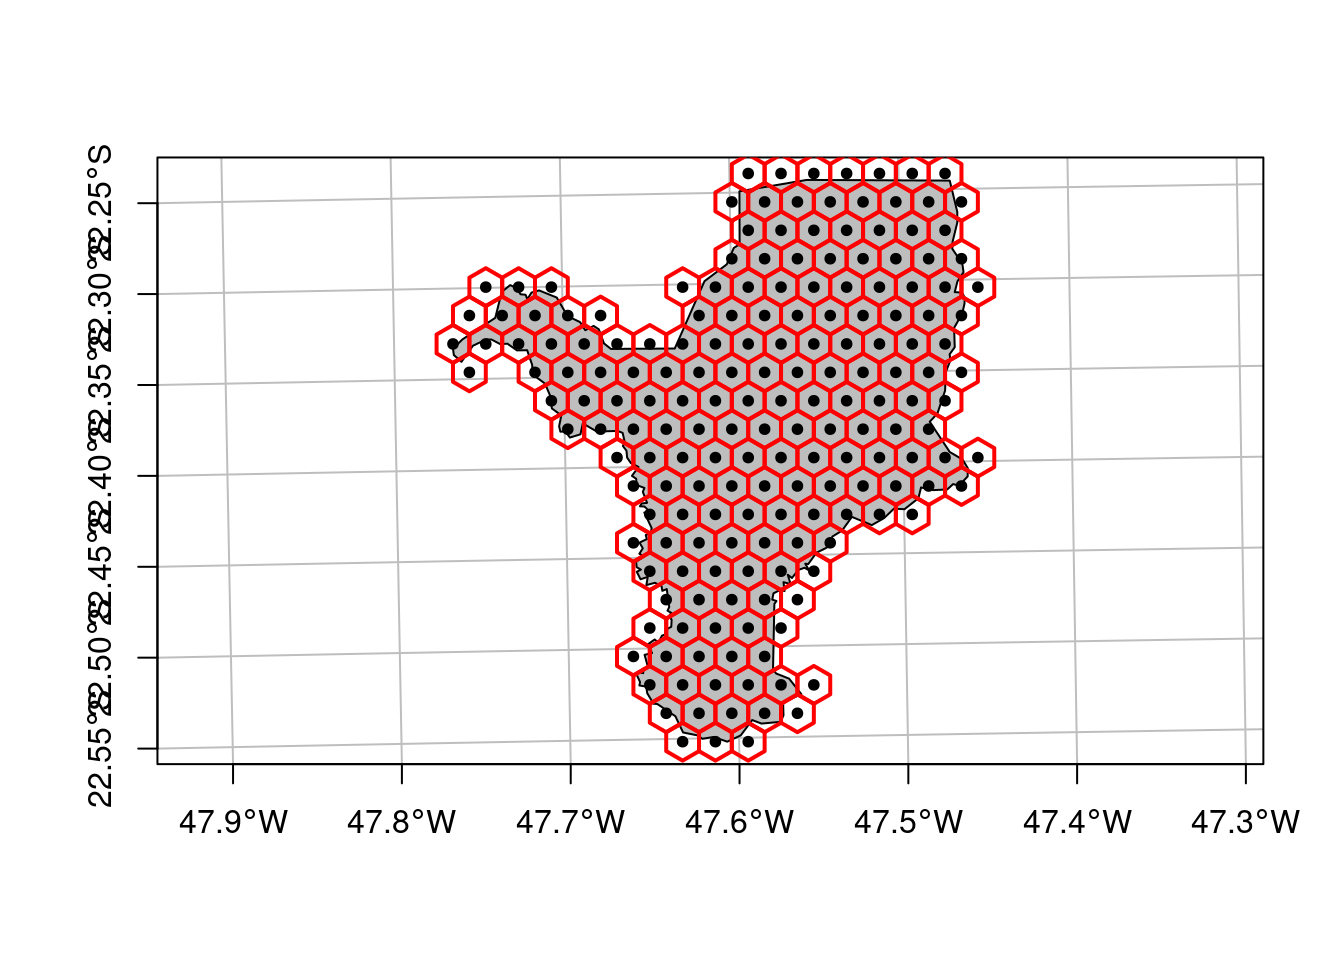
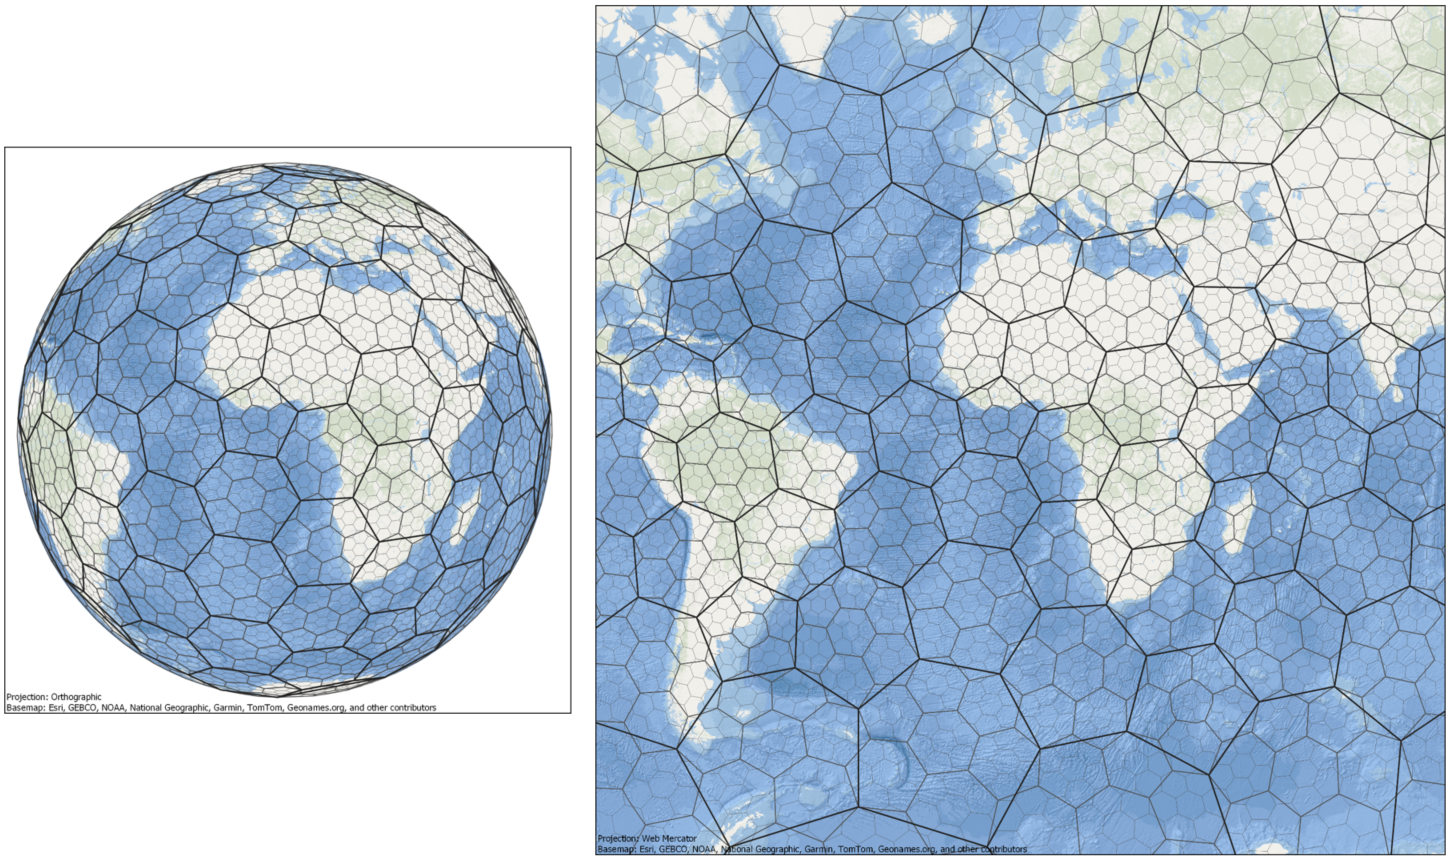
Spatial units - Hexagons
- Geographic area in regular hexagons
- Better for uniformity and connectivity, reduces edge effects
Spatial analysis
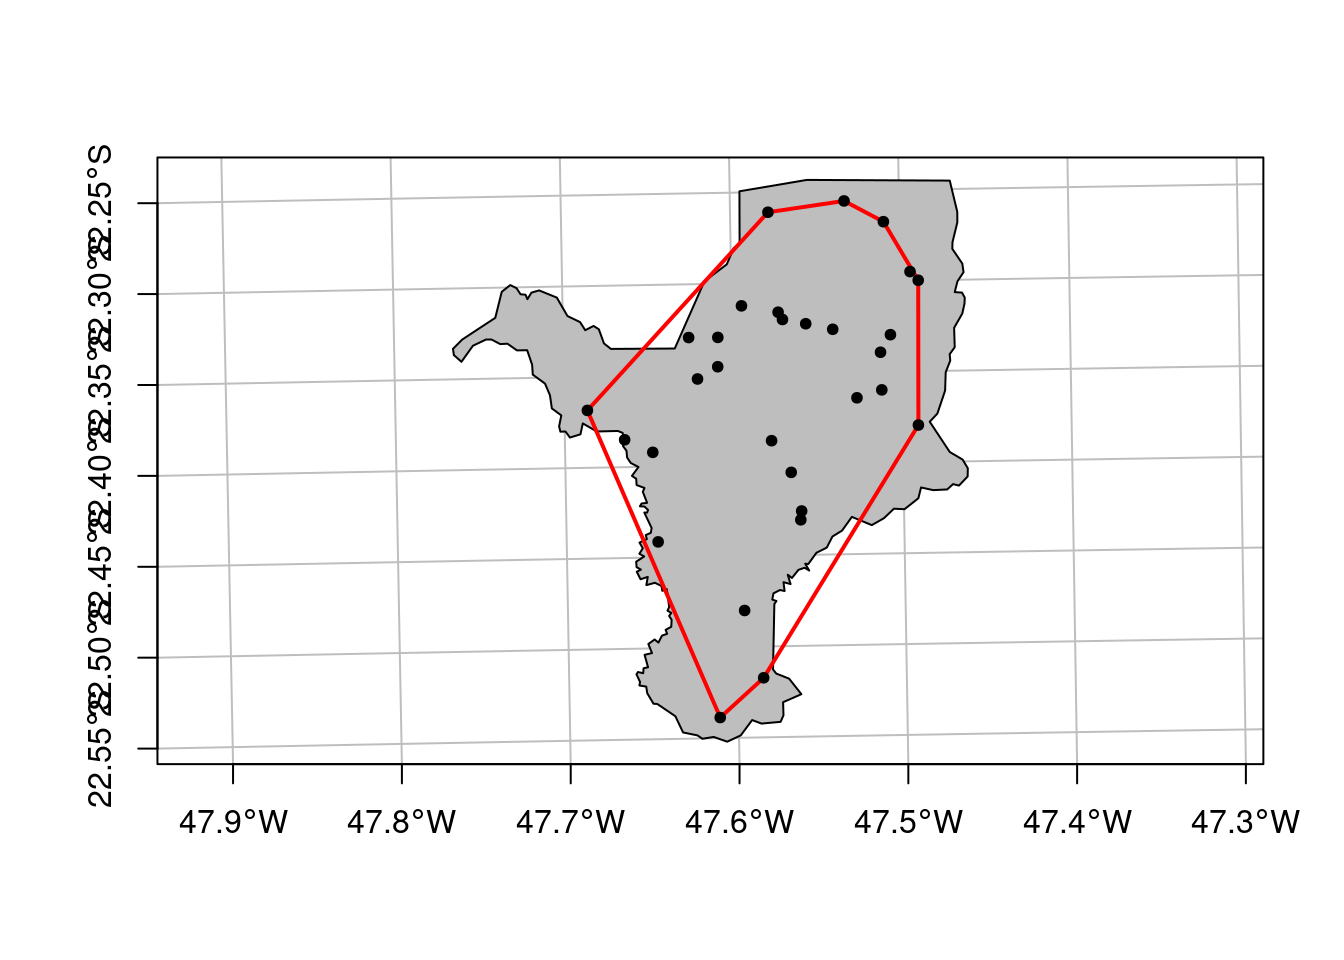
Convex hull
- Smallest convex region that contains all the occurrences

Spatial analysis
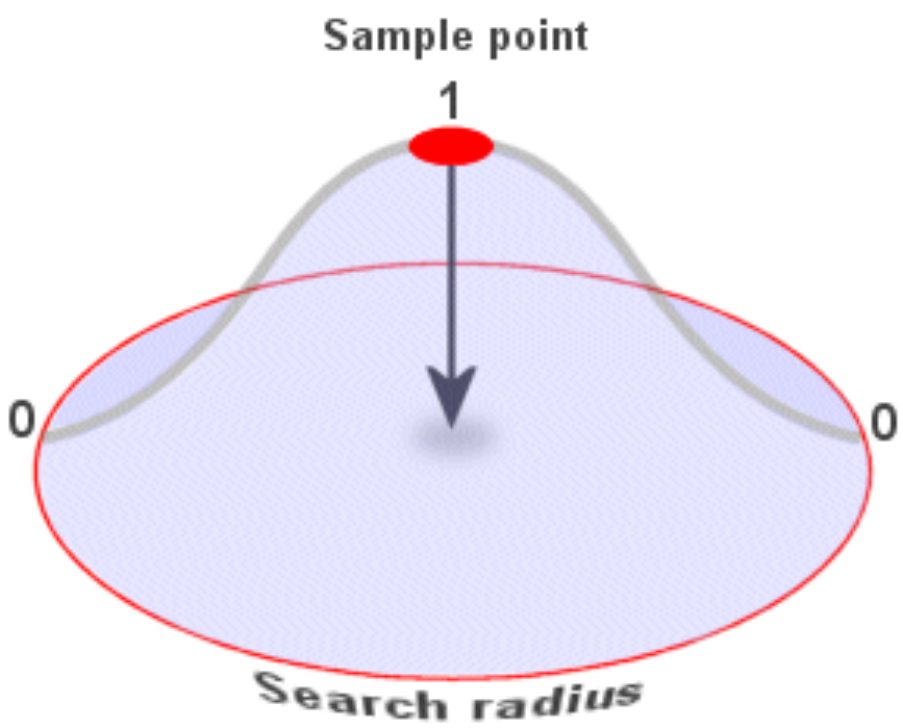
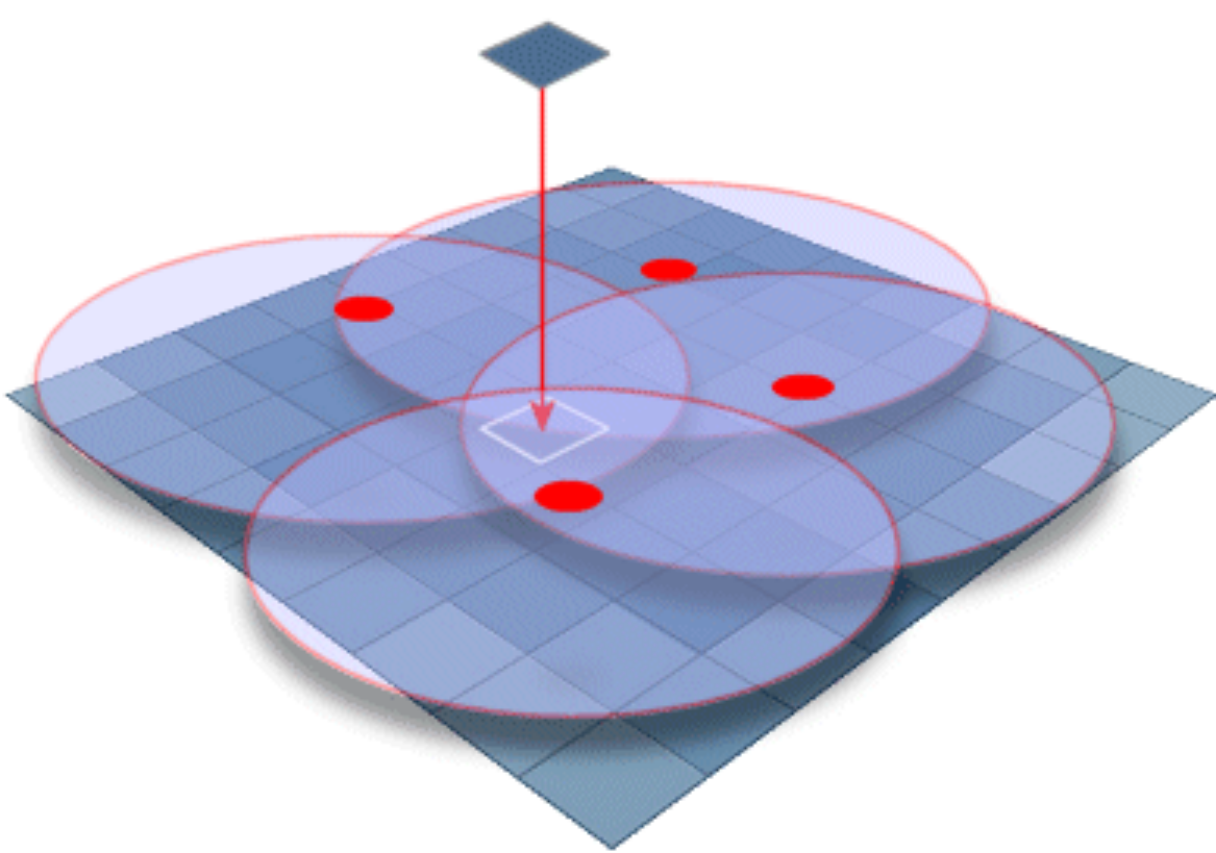
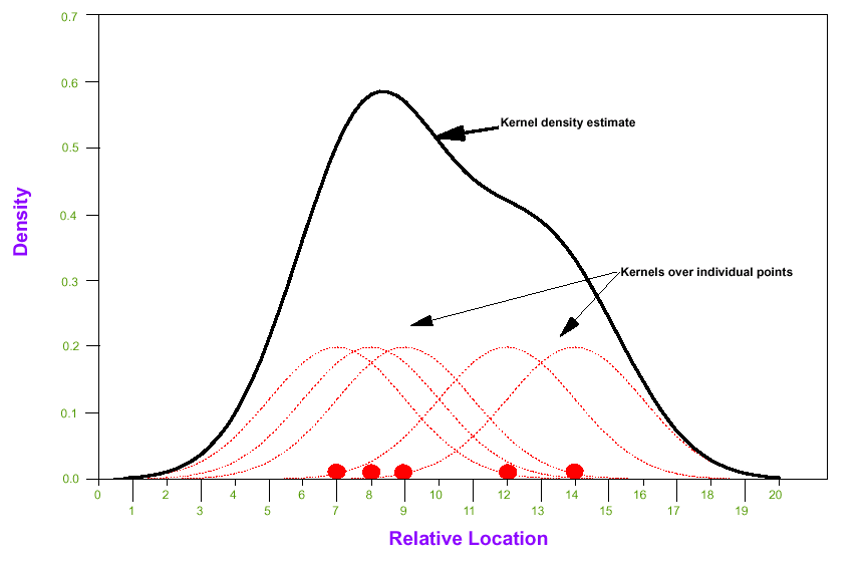
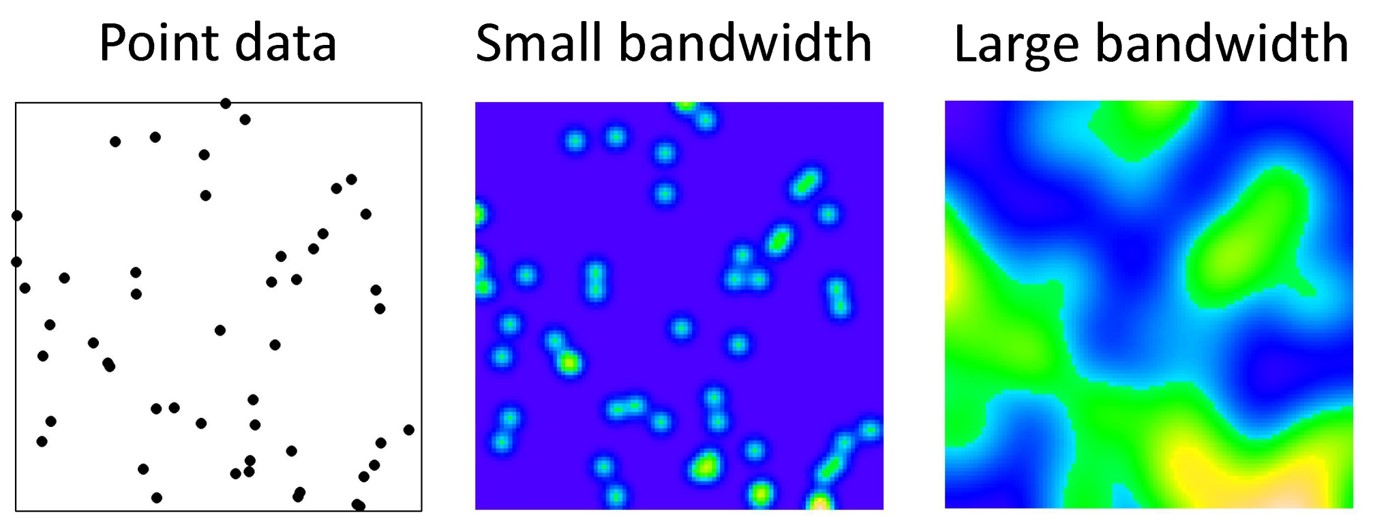
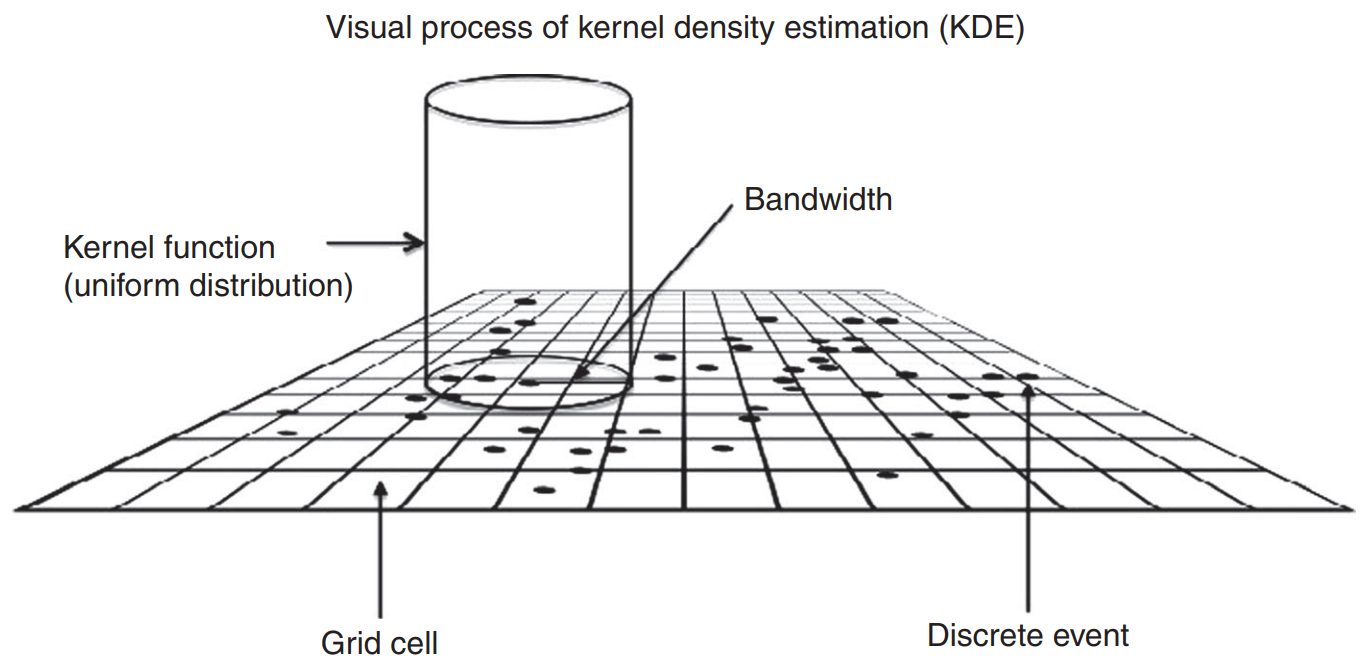
Point density (kernel maps)
- Represent the concentration of occurrences or events in a geographic area
Spatial analysis
Point density (kernel maps)
- Kernel functions
Spatial analysis
Point density (kernel maps)
- Bandwidth
Spatial analysis
Point density (kernel maps)
Kernel density estimation (KDE)
Spatial analysis
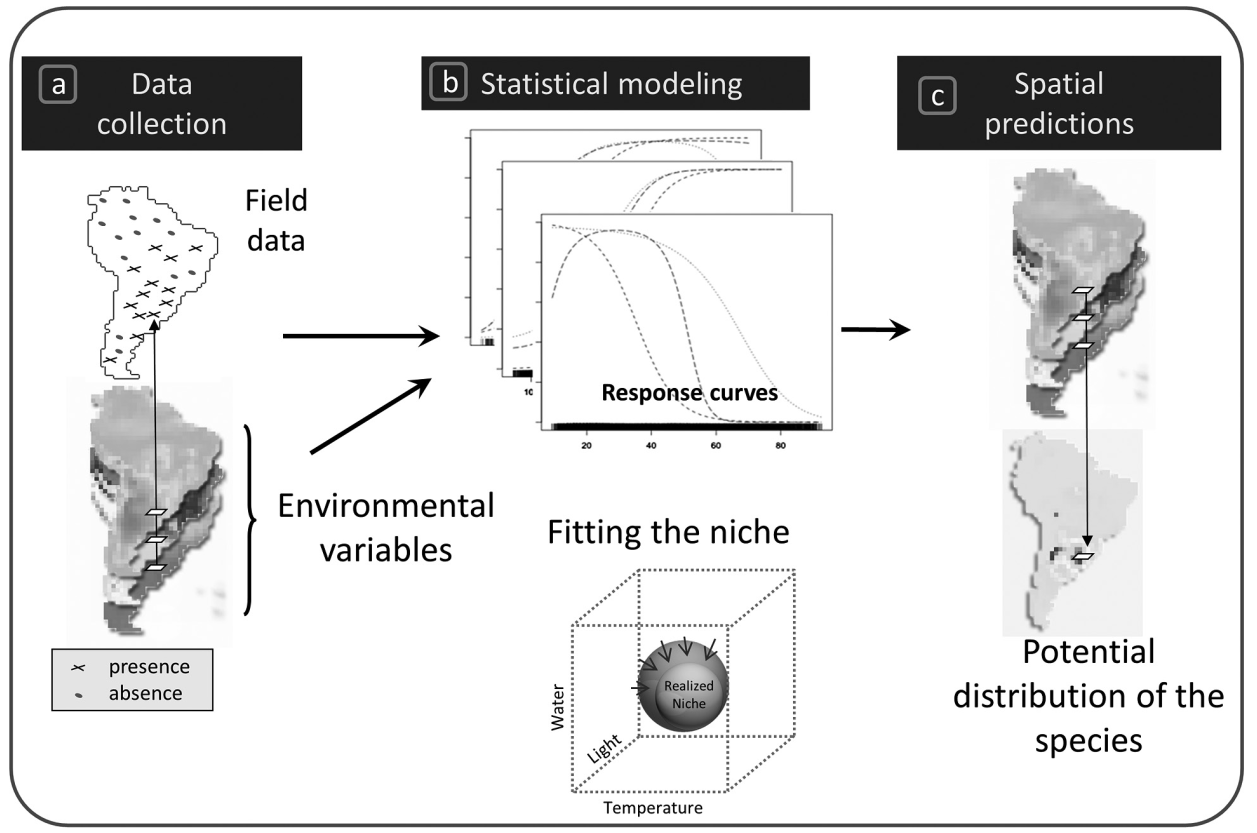
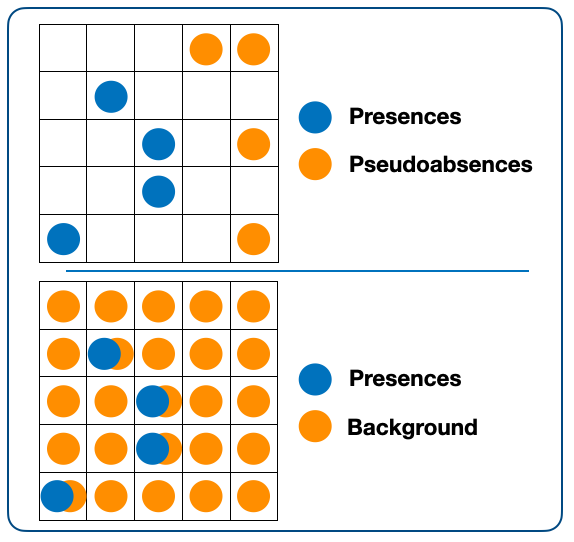
Species Distribution Modeling (SDMs)
Spatial analysis
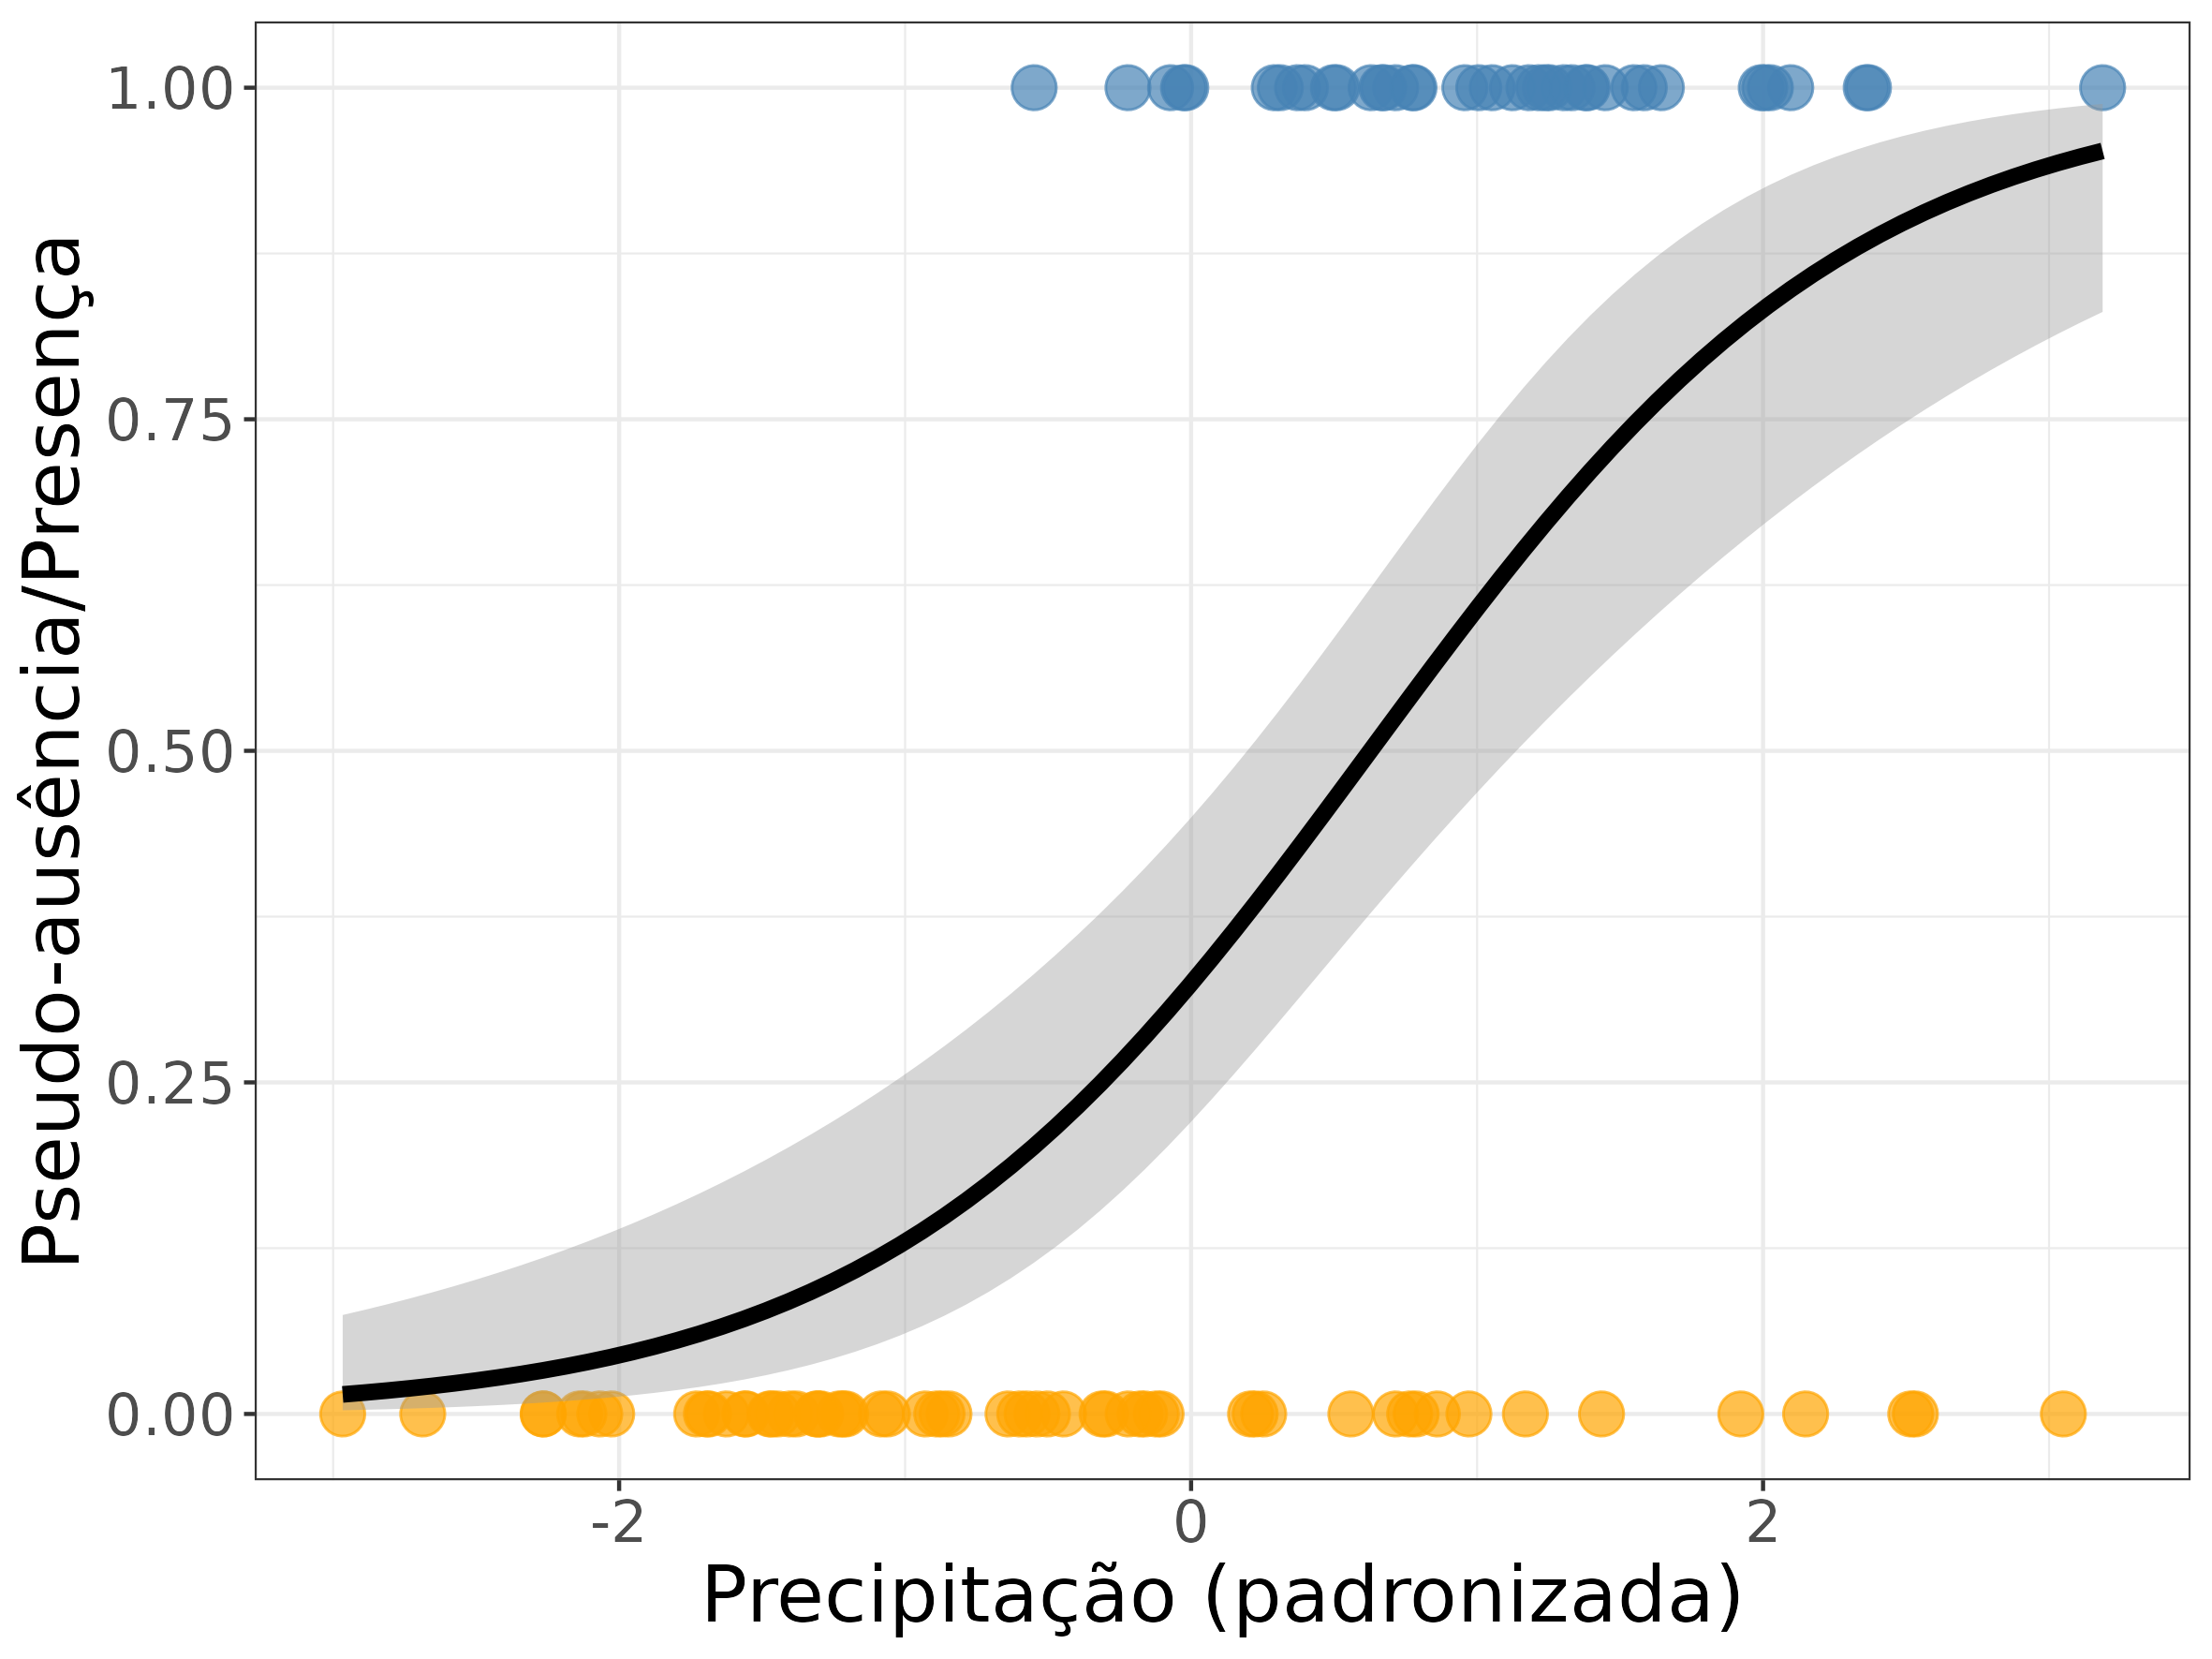
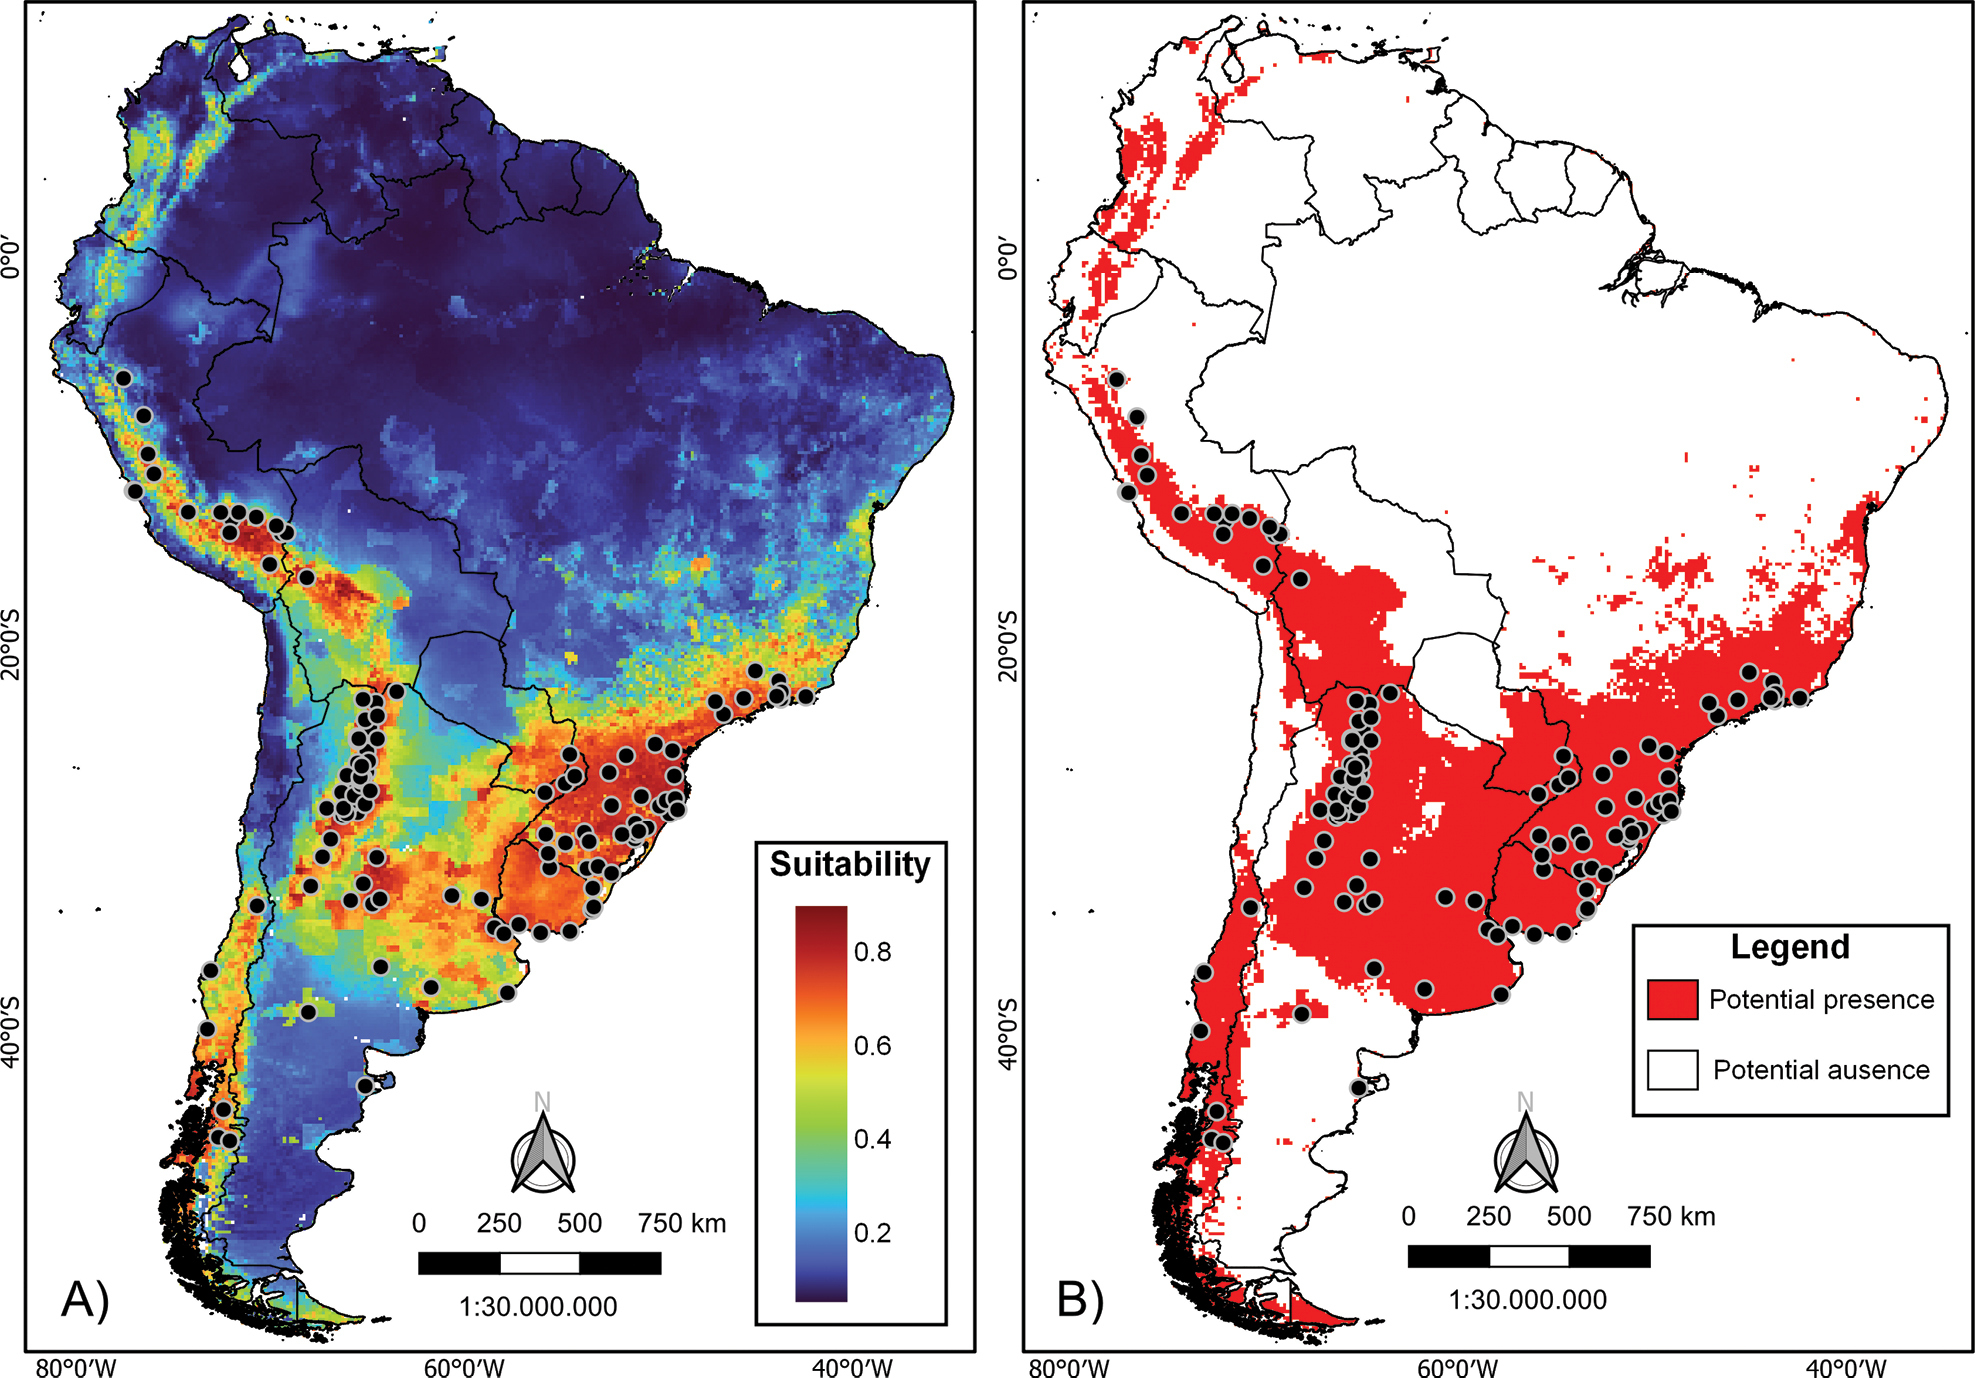
Species Distribution Modeling (SDMs)
- Generalized Linear Models (GLM) - binomial
Spatial analysis
Species Distribution Modeling (SDMs)
- Suitability map | Potential distribution
Spatial analysis
Species Distribution Modeling (SDMs)
Application: Seleção Natural Platform
Minimum Viable Product
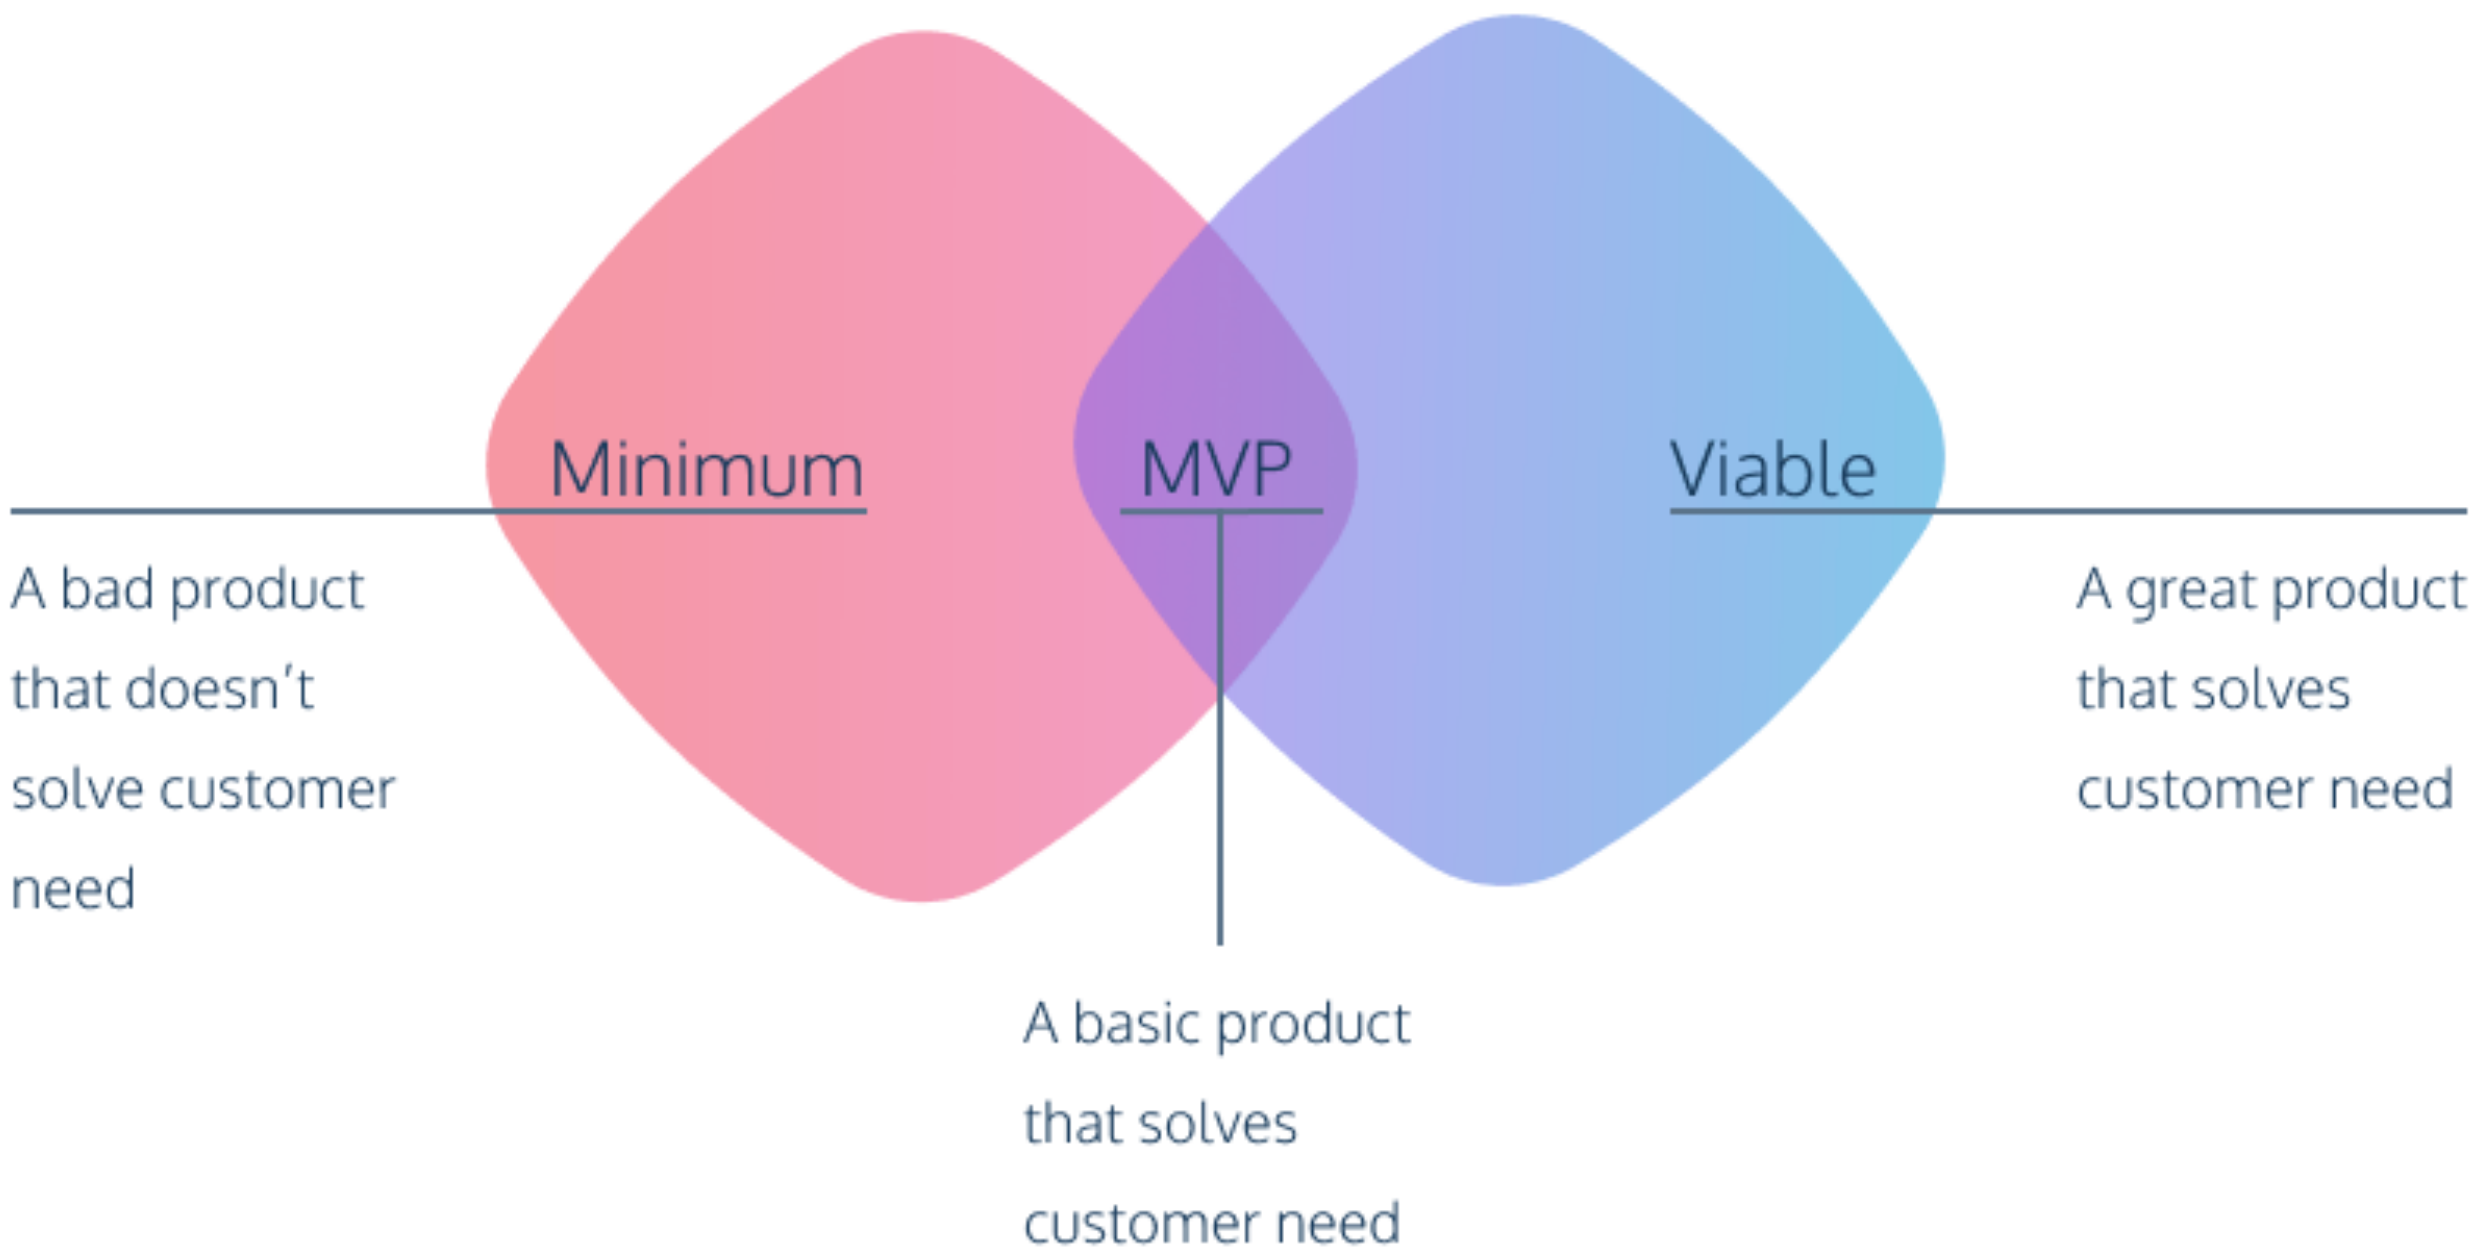
Application: Seleção Natural Platform
Aim
- Prioritizes vegetation fragments that are most relevant for biodiversity conservation
- Conservation actions:
- Searching for new populations
- Monitoring population dynamics
- Creating of protected areas
- Places for reintroduction of species

Application: Seleção Natural Platform
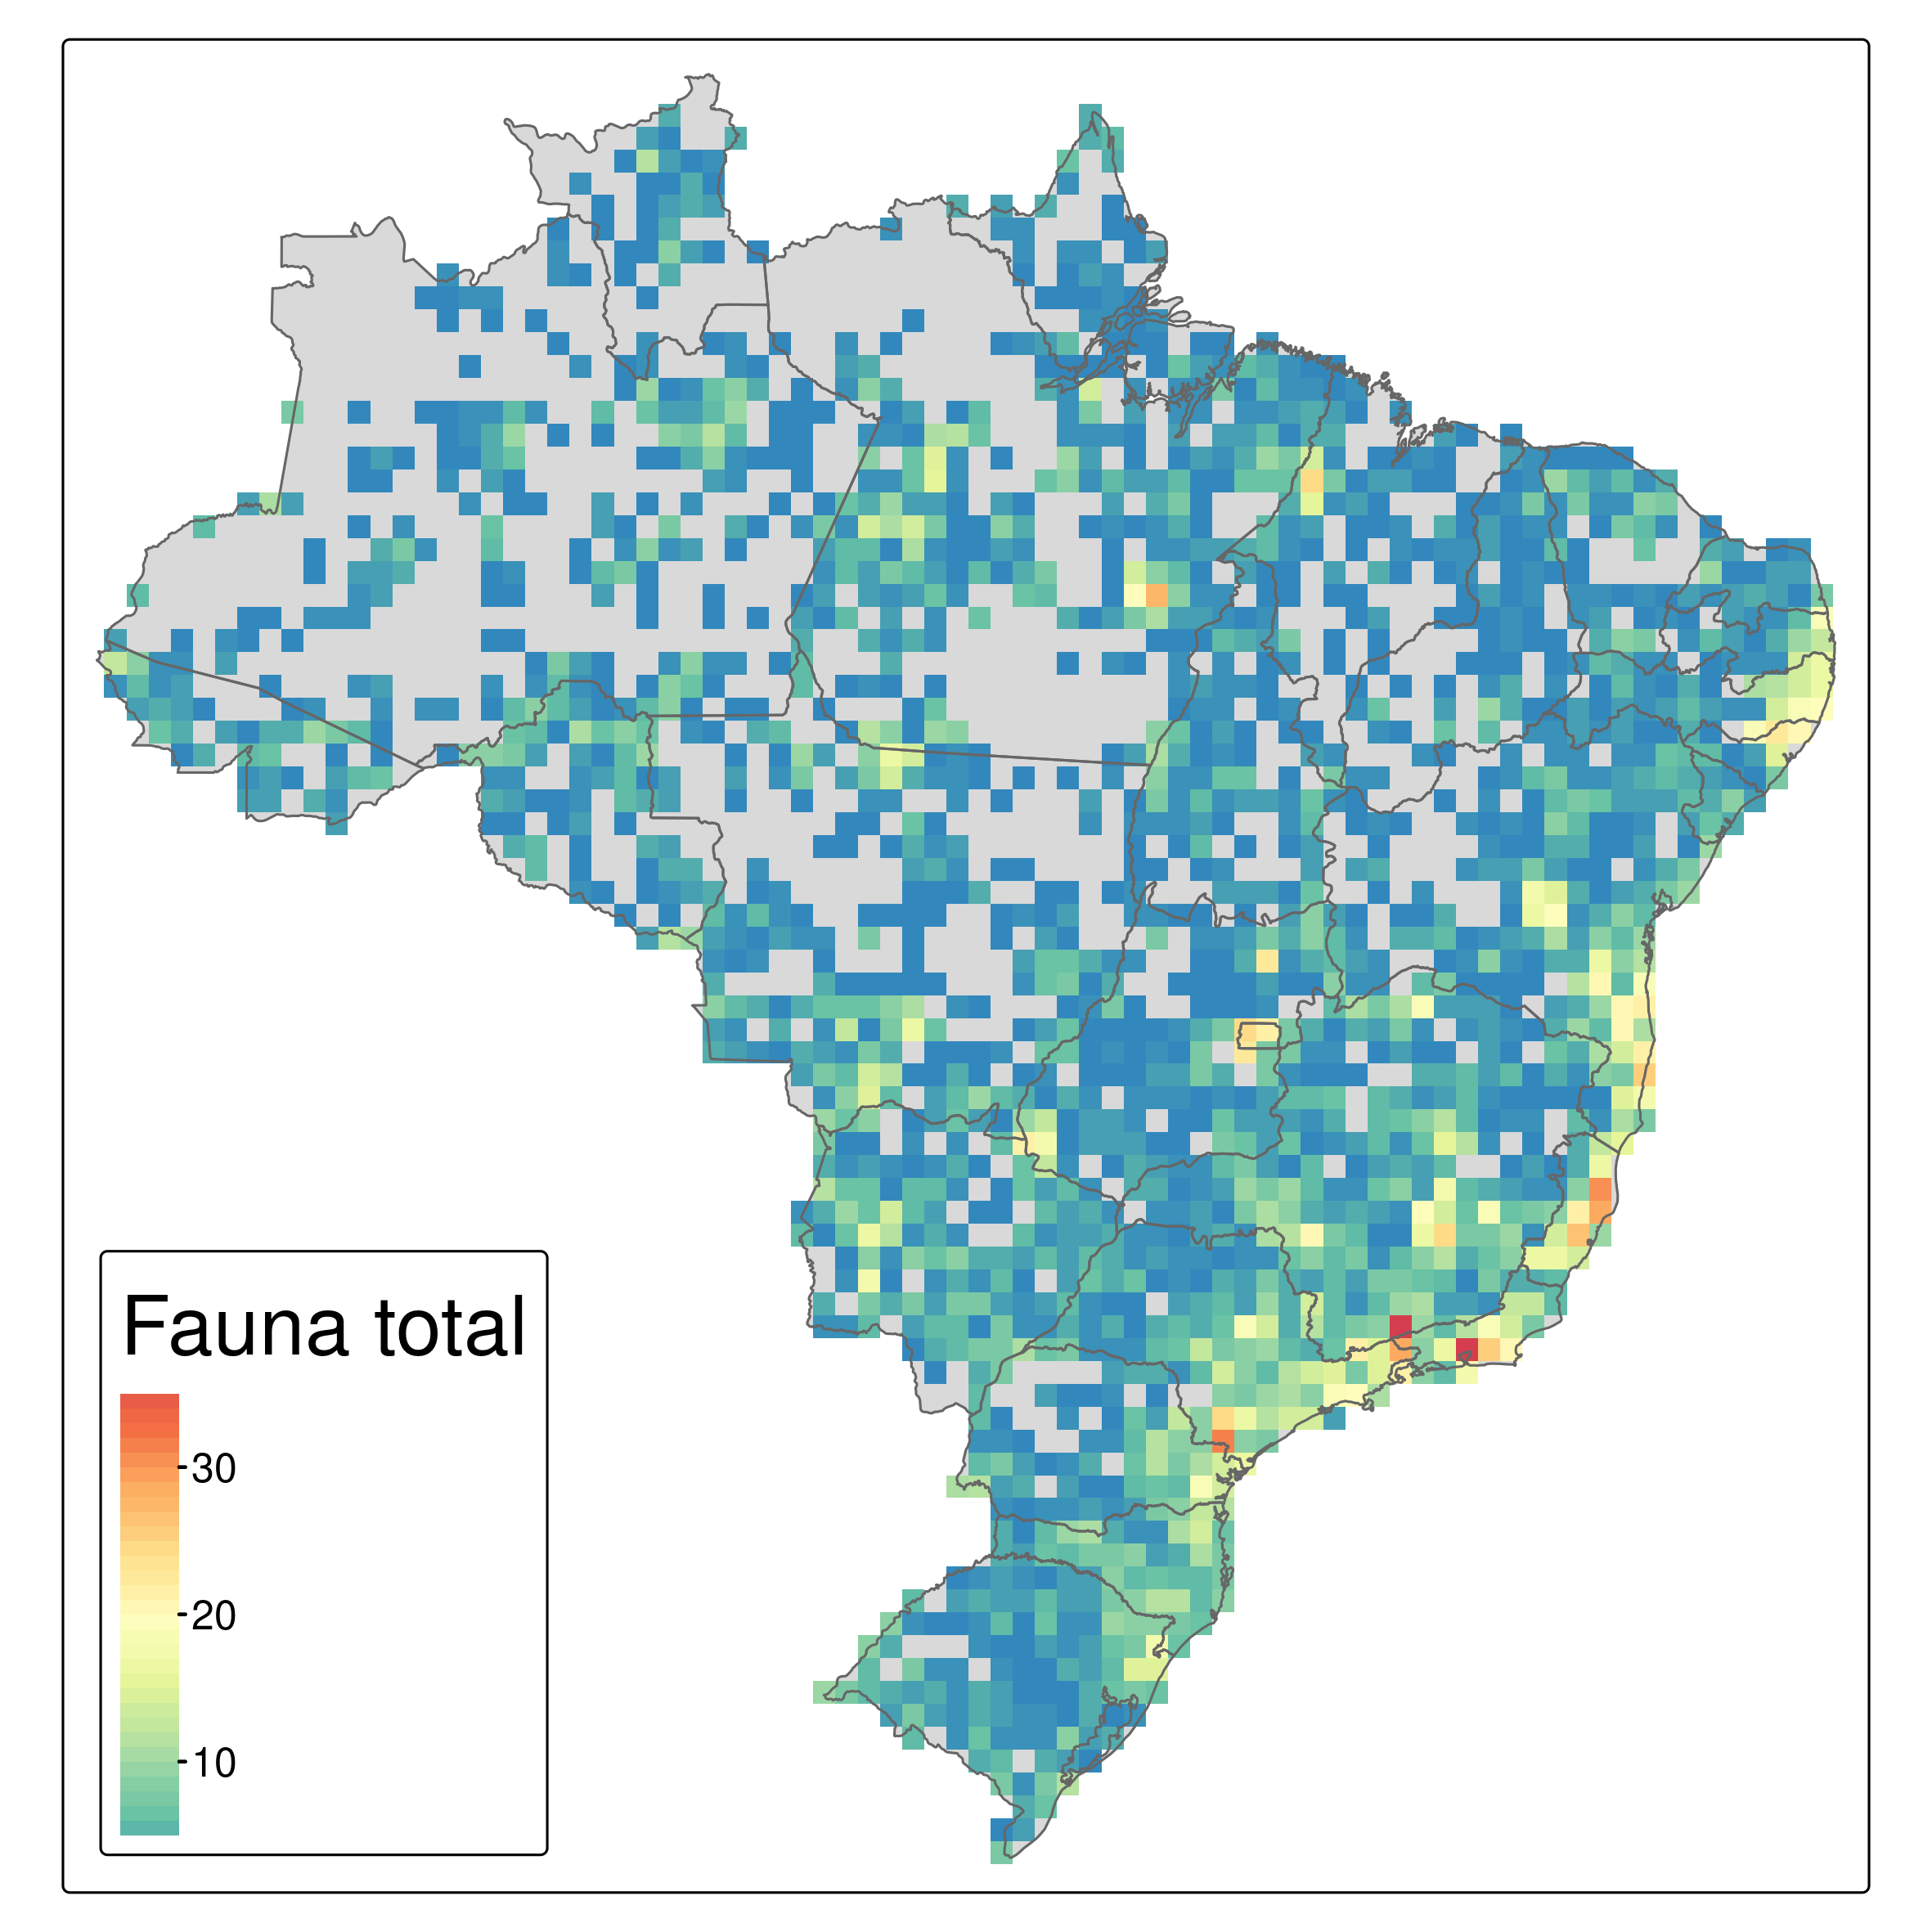
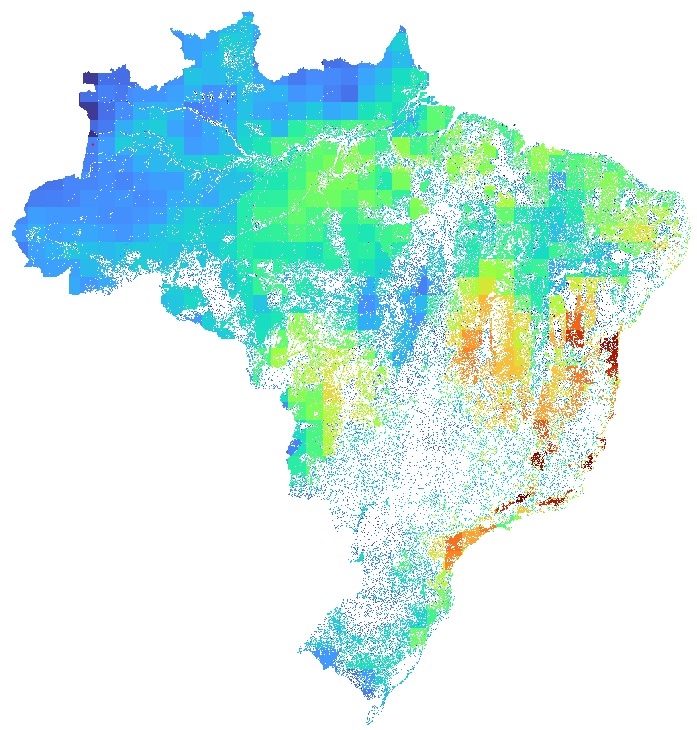
Methods
- SDMs to predict the potential distribution of endangered animal species
- Vegetation fragment prioritization based on species composition and landscape metrics
Application: Seleção Natural Platform
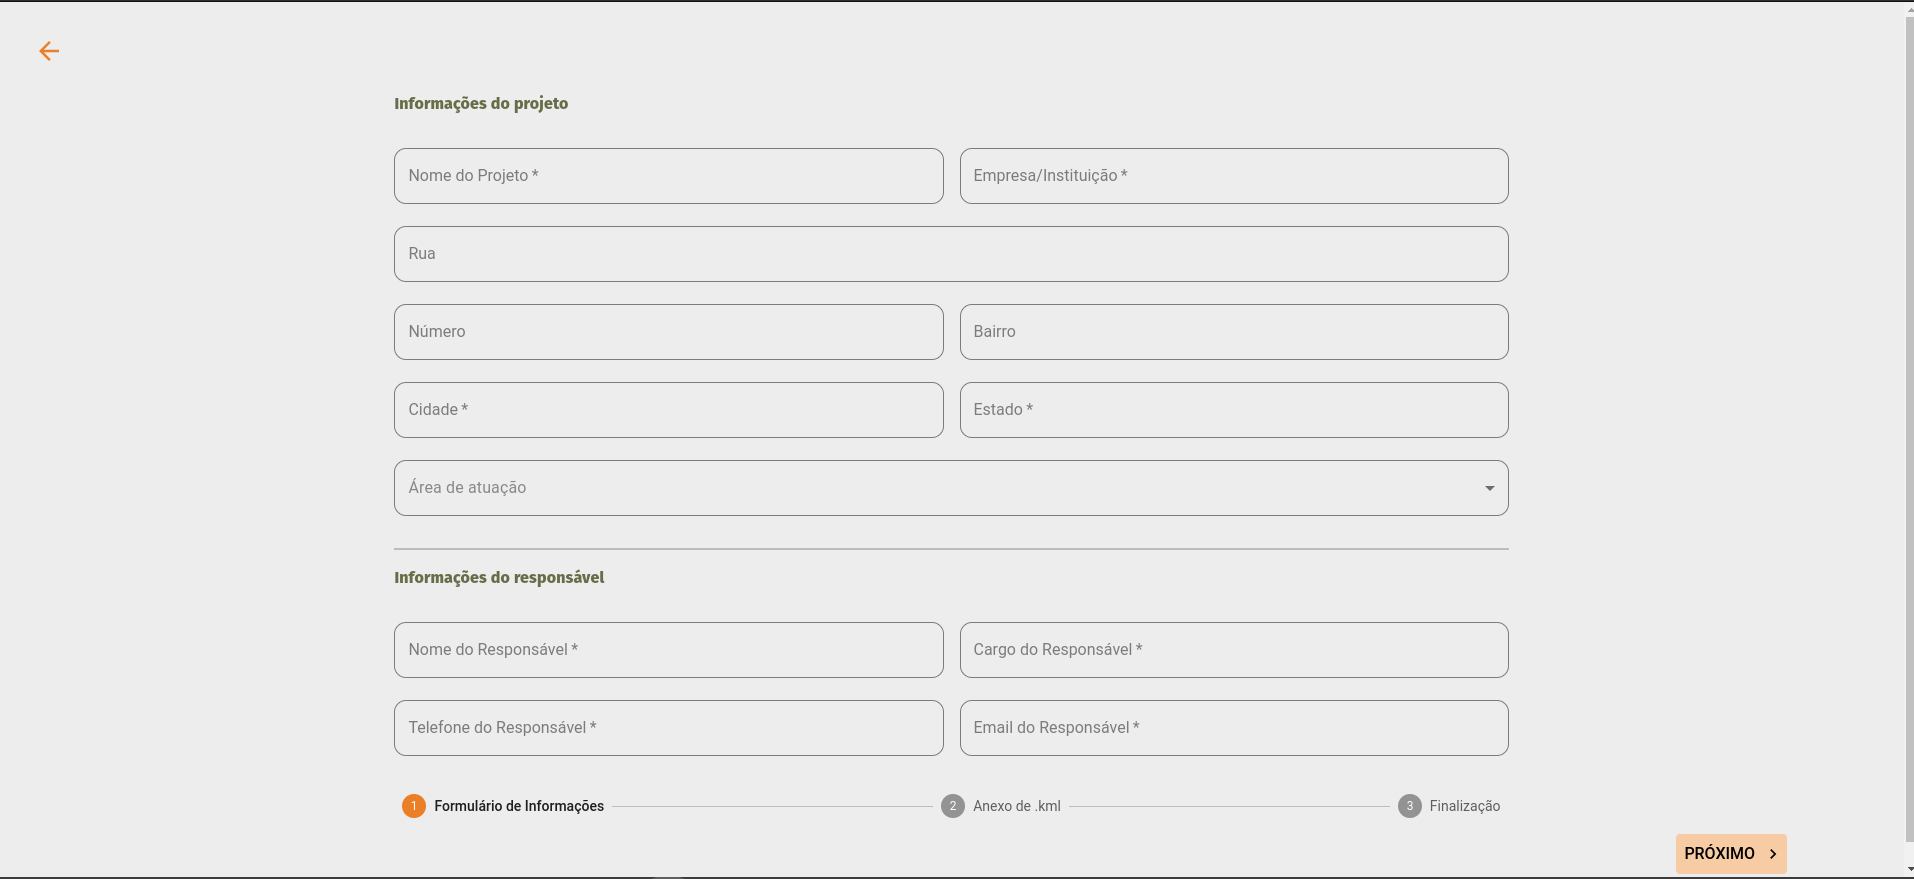
Workflow
- Client registration (user)
- Upload of one or more property boundaries (.kml) (user)
- Species composition and fragment ranking (automatic)
- Fragment selection (user)
- Conservation action plan (automatic)
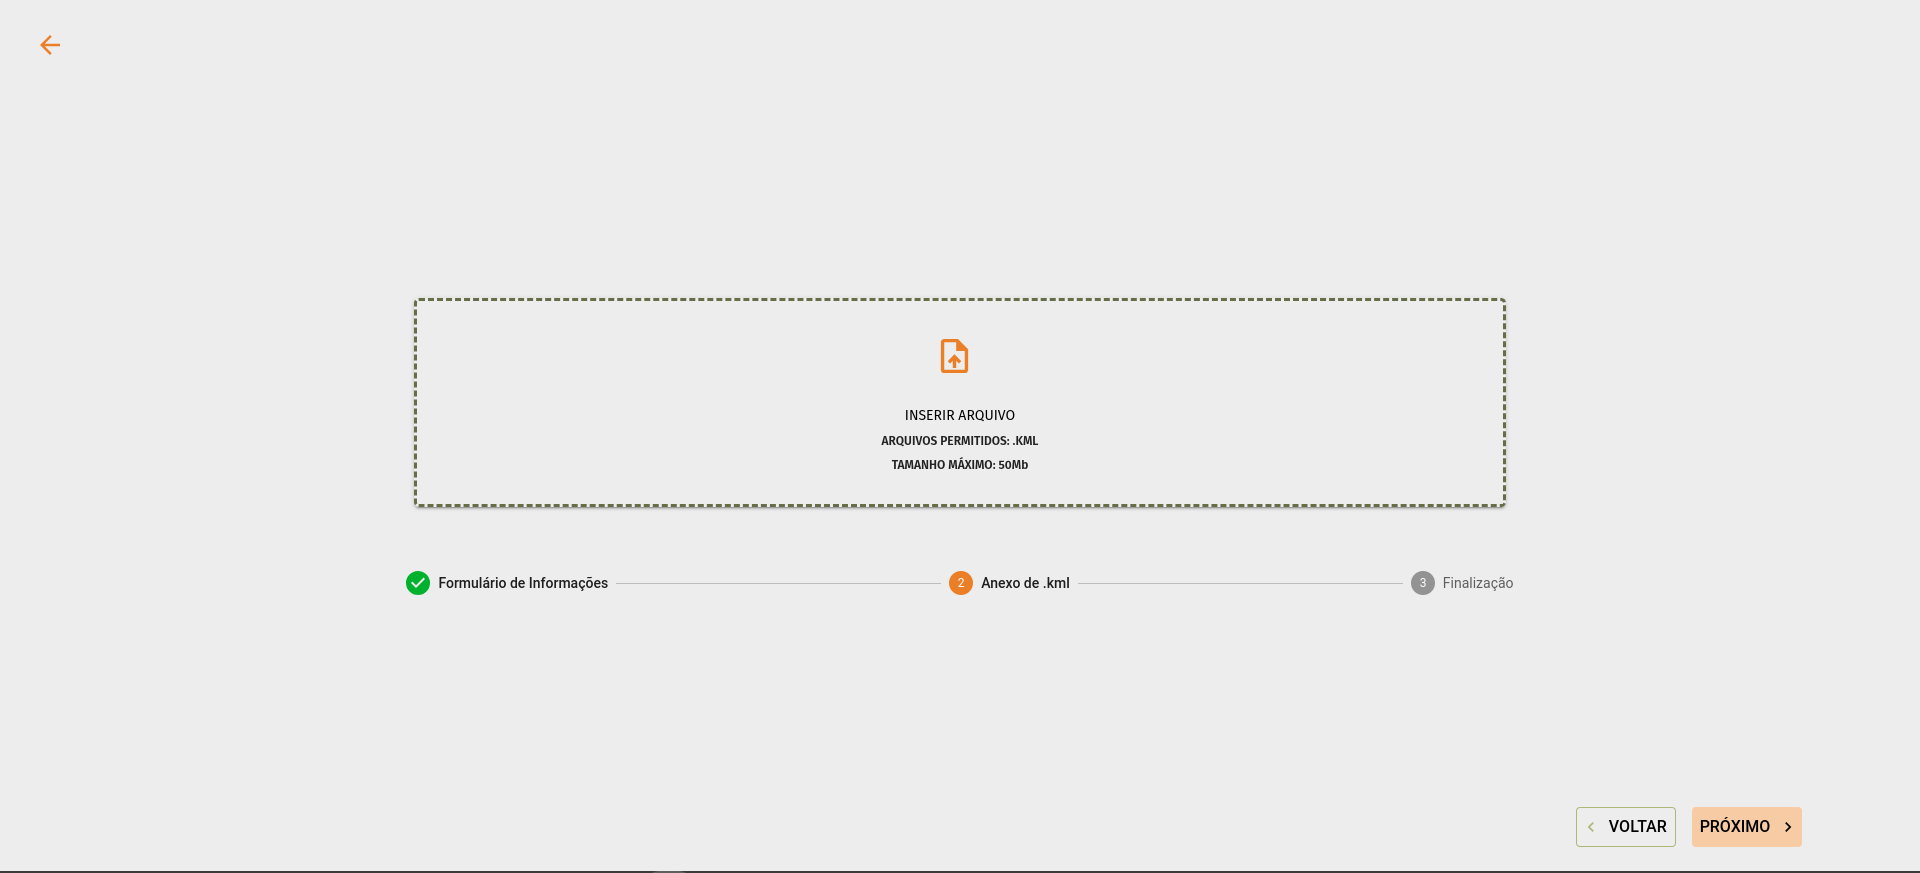
Application: Seleção Natural Platform
Platform
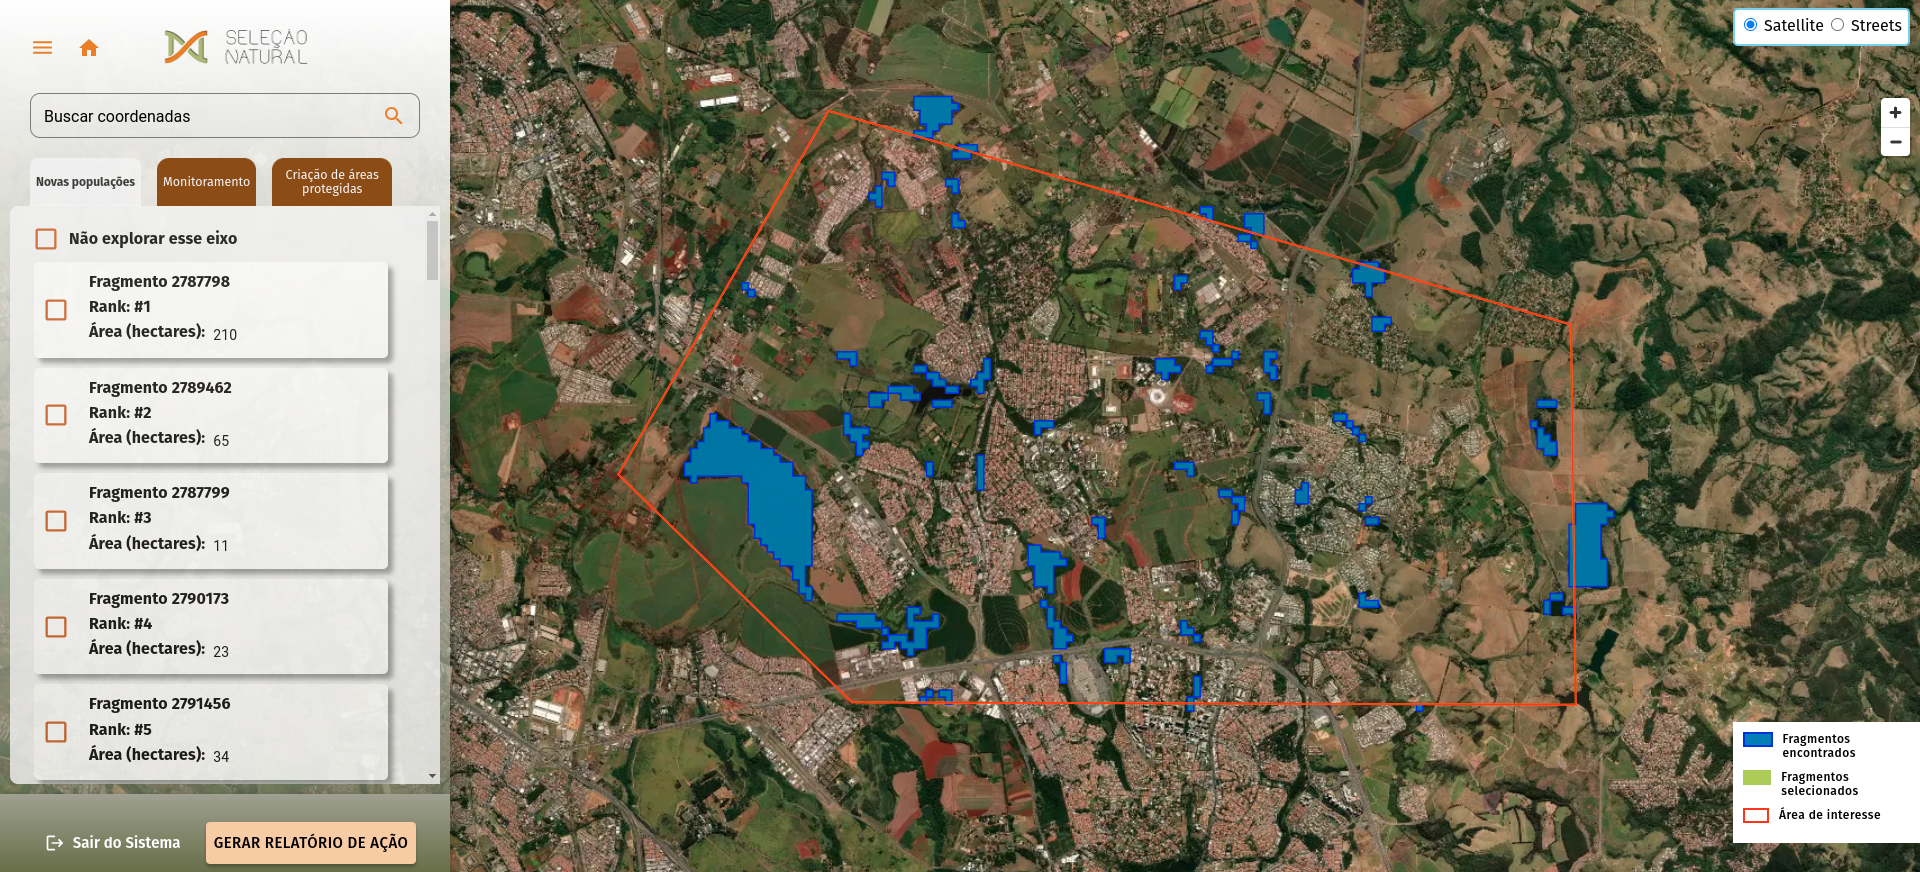
Application: Seleção Natural Platform
Platform
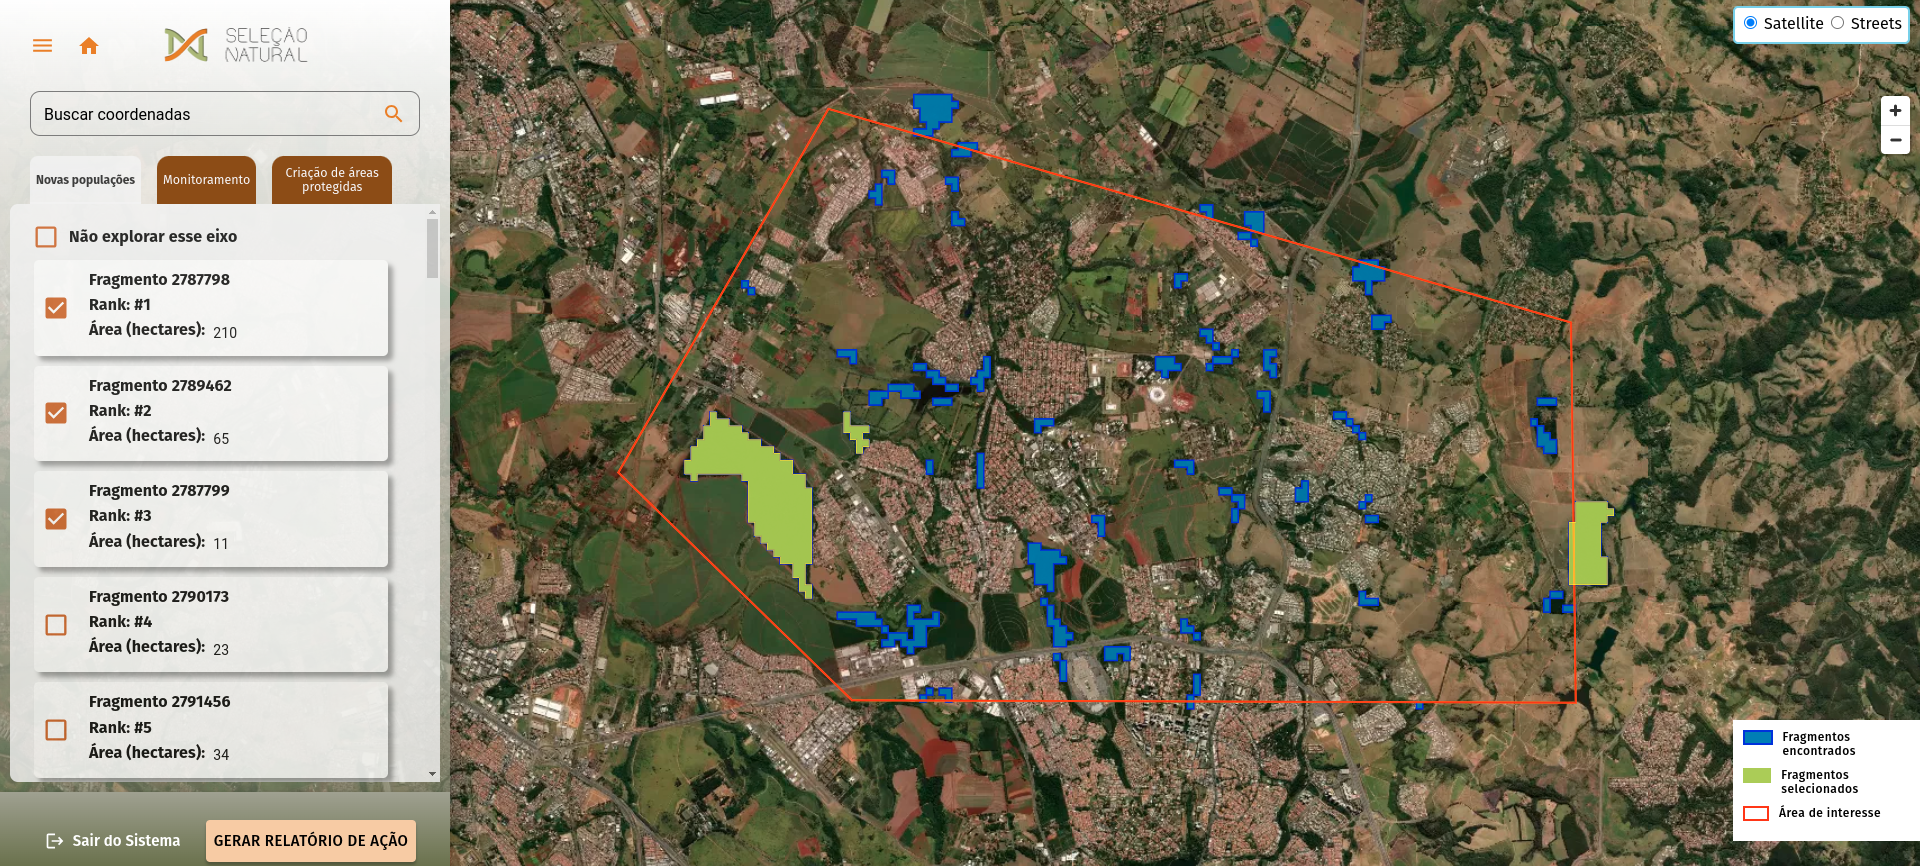
Application: Seleção Natural Platform
Platform
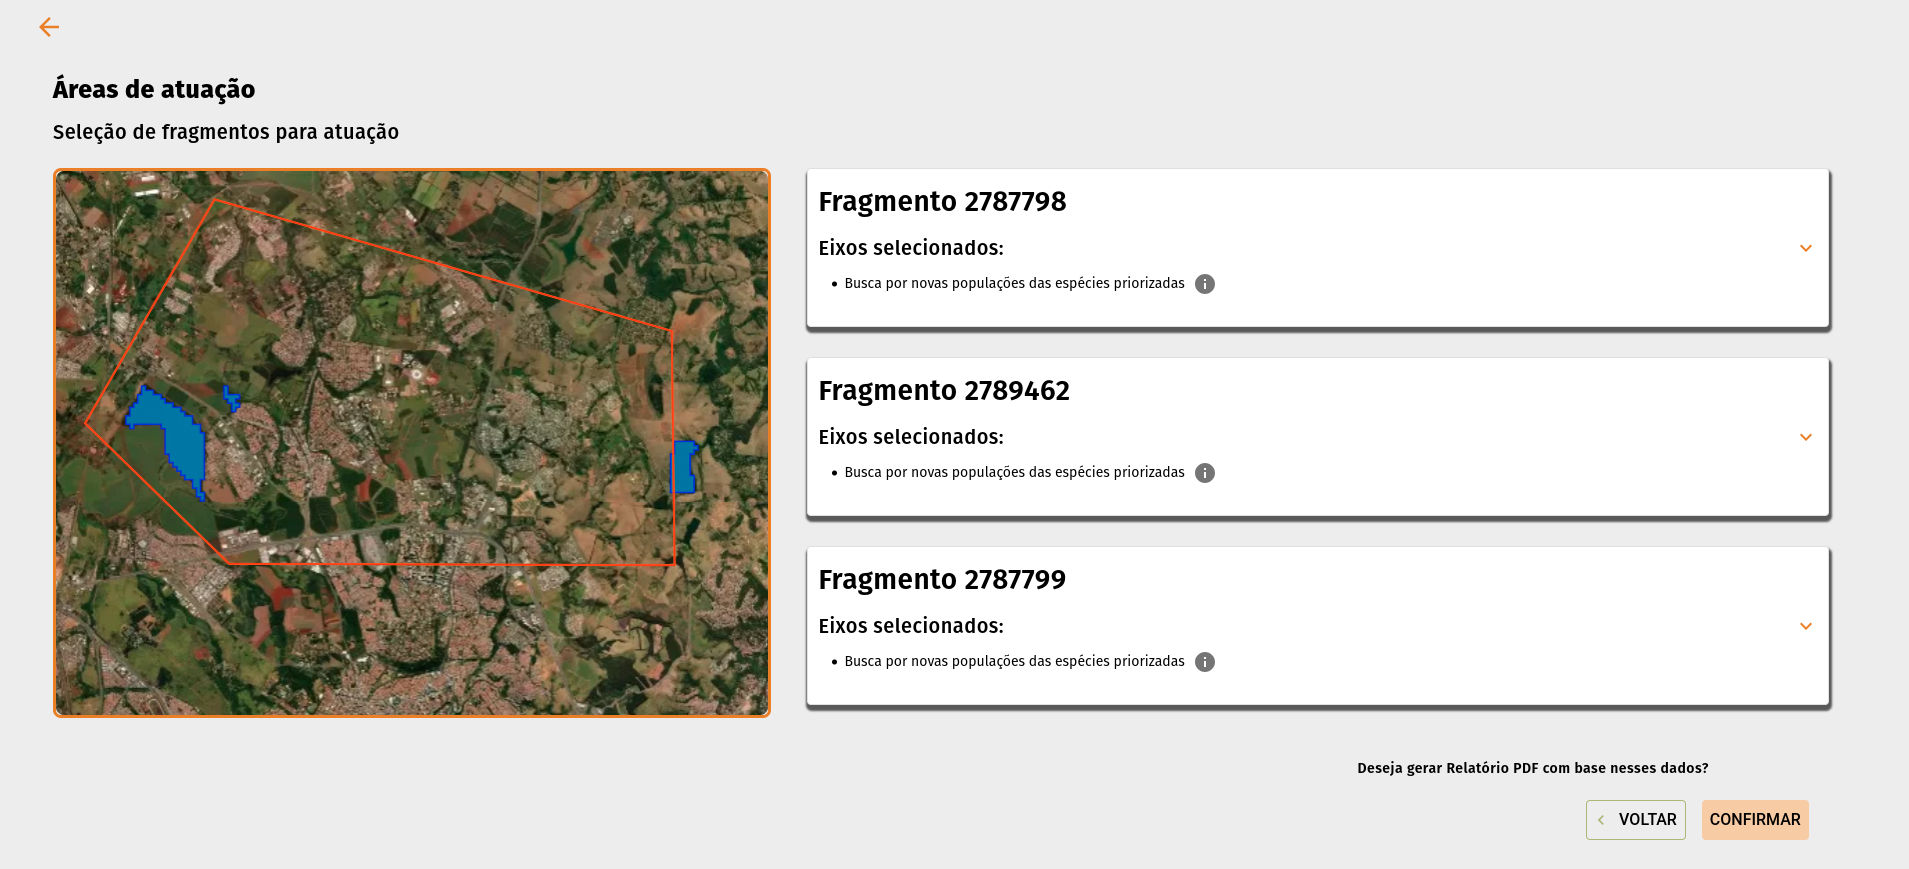
Application: Seleção Natural Platform
Platform
Questions?
Practical
R Programming Language

R Programming Language
Top 10 main concepts in R
- Console
- Script
- Operators
- Objects
- Functions
- Packages
- Help
- Environment
- Directory
- Citations
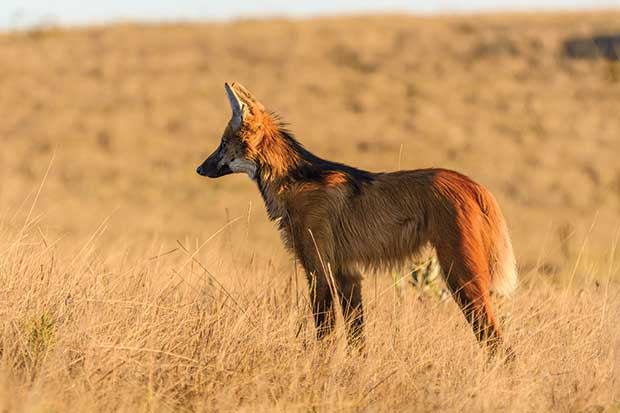
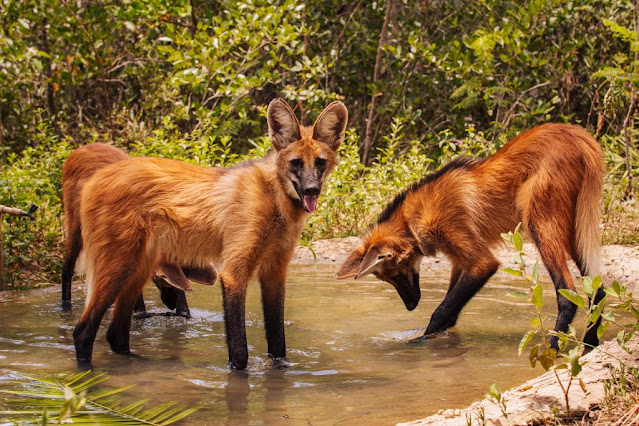
Chrysocyon brachyurus
Coolest mammal in the world
- English common name: Maned Wolf
- Portuguese common name: Lobo-guará
- The largest canid in South America, with reddish fur
- It lives in open and semi-open habitats (Brazilian Savanna - Cerrado)
Material
Access to GitHub

Readings
Articles
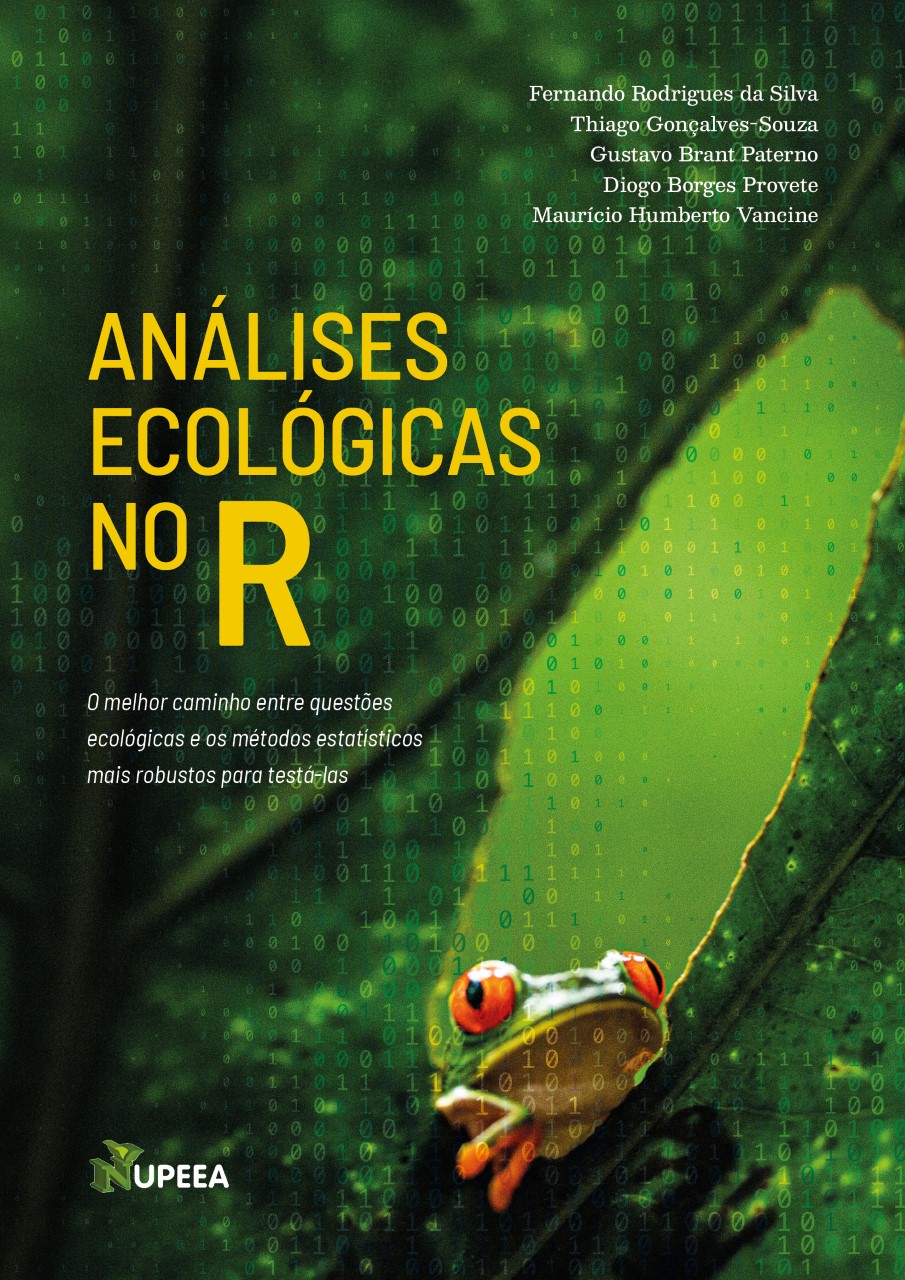
Books
Análises Ecológicas no R (2022)
Muito obrigado!
Acknowledgements:
- Mathias Pires
- Miltinho
- Flavia Pinto
- Matheus Lima-Ribeiro
- João Giovanelli

Slides by Maurício Vancine, made with Quarto. Code available at GitHub.

